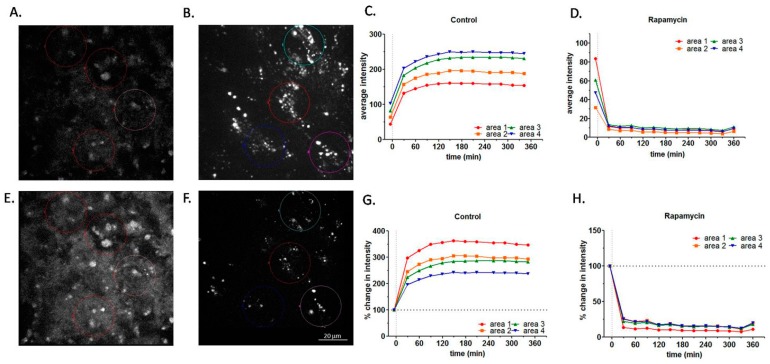
Figure 2.
Effect of rapamycin treatment on RPE autofluorescence by live cell imaging. (A,B,E,F) Microphotographs of RPE autofluorescence obtained with live cell imaging at 610 nm before and after the addition of rapamycin or PBS. (A) Combined confocal control image before the addition of PBS; (B) Combined confocal control image before the addition of rapamycin (10 µM); (E) Combined confocal image at 342 min after the addition of PBS; (F) Combined confocal image at 360 min after the addition of rapamycin. Four color circles indicate the areas chosen for the quantitation of autofluorescence over time. (C,D,G,H) Quantification of autofluorescence in live cell imaging. Quantification of the RPE autofluorescence registered by live cell imaging presented on panels A,B,E,F and Supplemental Movies 1 and 2; (C) Changes in absolute intensity vs. time with PBS treatment (control) for each of the four colored circular regions outlined in panels A,B,E,F. Please note that the initial conditions in Panels C and D (time 0) are very similar; (D) Changes in absolute intensity vs. time with rapamycin treatment for the four circular regions; (G) Changes in relative intensity (post-treatment intensity for each circular region normalized towards the corresponding intensity pre-treatment) vs. time with PBS treatment; (H) Changes in relative intensity vs. time with rapamycin treatment (normalization as in C). Scale bar—20 µm. For more details, see the Methods section of the main text.

