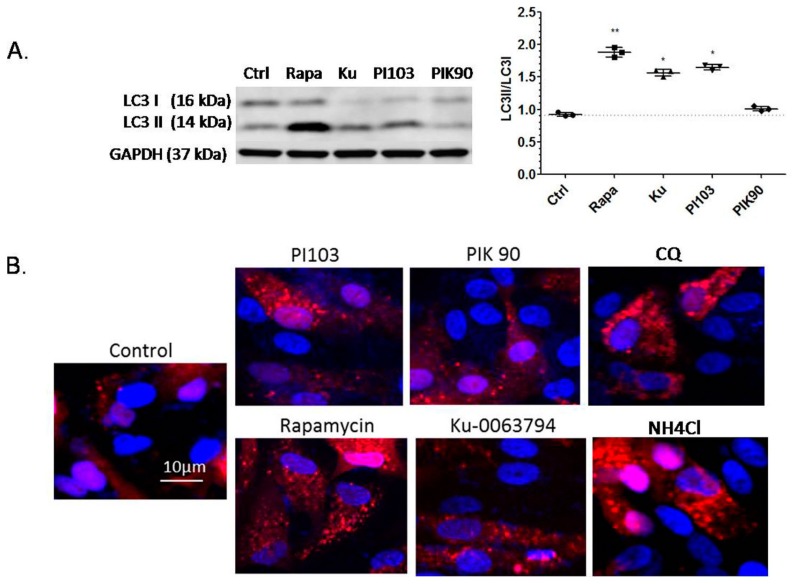
Figure 3.
Effects of autophagy induction and lysosomal inhibitors on protein expression and lysosomal activity by confocal microscopy.(A) Western blot results for the microtubule-associated protein 1 light chain 3 (LC3). Upper part: LC3-1 (LC3-I) form (cytoplasmic form); lower part: LC3-2 (LC3-II) form (autophagosomal form) of the ARPE-19 cells at 8 h after no treatment (Ctrl), or after treatment with rapamycin (RAPA, 10 µM), KU-0063794 (Ku, 5 µM), PI-103 (PI103, 1 µM) and PIK-90 (1 µM); LC3-II/LC3-I ratios were calculated and the values are presented as means and standard deviations, based on three replicates; Significant differences between different groups are denoted with an asterisk/s (post-hoc Dunnett’s multiple comparisons test; * p < 0.05; ** p < 0.01); (B) Confocal microphotographs of ARPE-19 cells transfected with mCherry-LC3 at 48 h after the single addition of: 10 μM rapamycin, 1 µM PI-103, 1 µM PIK-90, 5 µM Ku-0063794, 10 µM of NH4Cl, 20 µM of chloroquine, and PBS (control). Note the punctate appearance of the fluorescence in cells treated with the drugs compared to the cells treated with PBS (control). Red color represents mCherry-LC3, blue indicates cell nuclei (DAPI).

