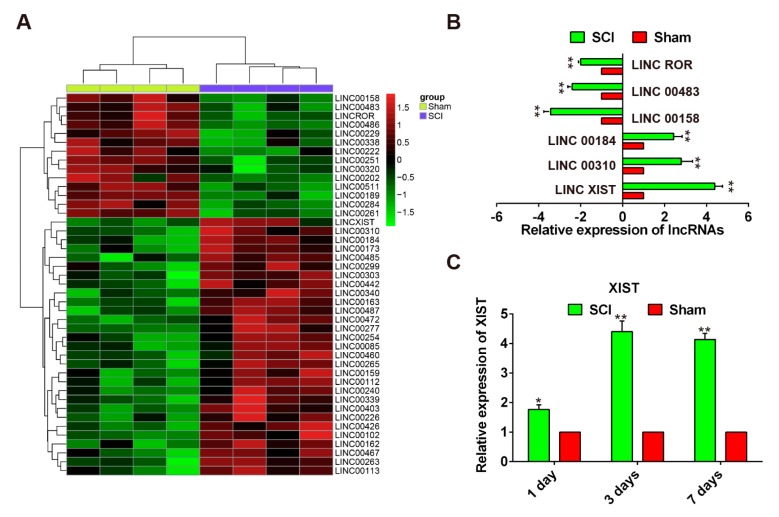
Figure 2.
Upregulation of lncRNA-XIST in SCI model rats. (A) Heat map representation of differentially expressed lncRNAs in the sham and SCI group. Data were retrieved from the GEO dataset (accession number GSE5296). Expression values are represented in shades of red and green which indicate expression above and below the median expression value across all samples. (B) qRT-PCR analysis of six lncRNAs selected from the results of the microarray analysis, in spinal cord tissues collected from SCI model rats (n = 4/group). (C) Expression levels of lncRNA-XIST at one, three, and seven days after SCI, measured by qRT-PCR (n = 3/group/time point). Relative expression represents changes compared with the sham group, after SCI. Data are means ± SEM. * p < 0.05, ** p < 0.01 vs. the sham group.

