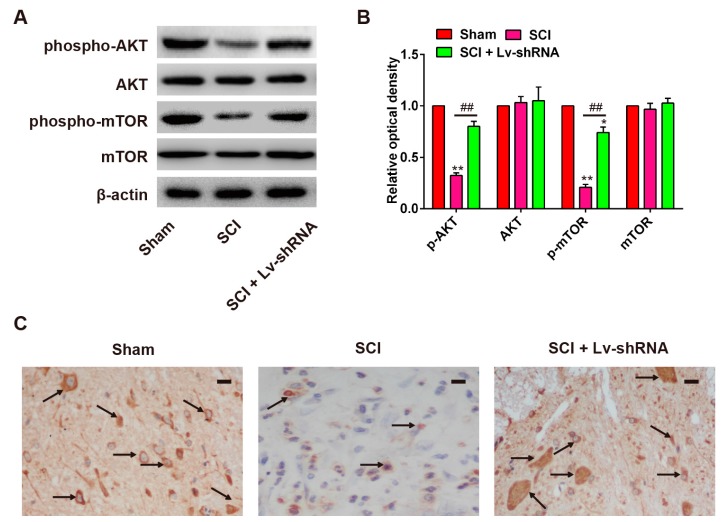
Figure 4.
Effect of Lv-shRNA on activation of the PI3K/AKT/mTOR pathway in SCI rats. (A,B) Protein expressions of p-AKT, AKT, p-mTOR, and mTOR in rat spinal cord segments at the contusion epicenter. β-actin was used as the loading control and for band density normalization. Band optical densities were measured using Image-Pro Plus software. * p < 0.05, ** p < 0.01 vs. the sham group. ## p < 0.01 vs. the SCI group. n = 4/group. (C) Expression of p-AKT among the treatment groups as detected by immunohistochemistry staining. n = 4/group. The black arrows indicate cells stained positive with anti-p-AKT. Data are means ± SEM. Scale bars in (C) 20 μm.

