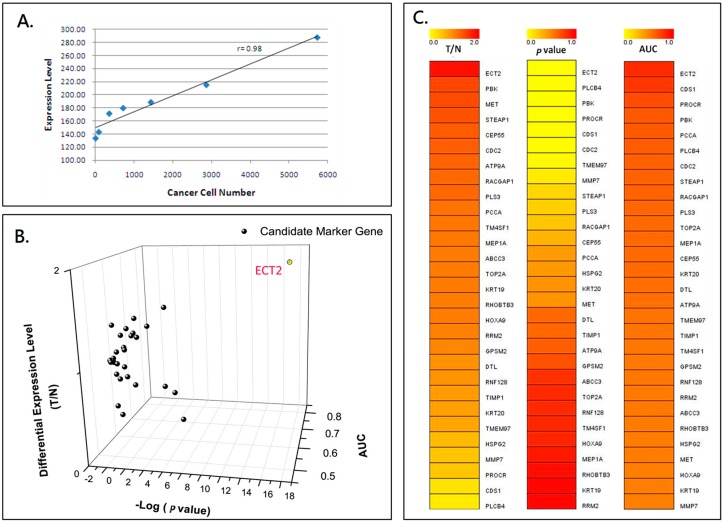
Figure 1.
mRNA expression of candidate marker genes of peripheral blood cells for detecting circulating tumor cells in colorectal cancer patients. (A) This scatter plot shows that the relative expression of the tested gene is linearly correlated with cancer cell numbers. The curve was generated by taking the mean of triplicates of each data point. (B) The 3D scatter plot shows the distribution of three evaluation criteria: p-value, area under the curve (AUC), and gene expression ratio (Patients vs. Normal) for 29 tested marker genes. The epithelial cell transforming sequence 2 oncogene (ECT2) gene had the highest differential gene expression ratio, largest area under the curve, and the most significant p-value among all tested genes. (C) The three heatmaps show the individual ranking of each tested marker gene for the three evaluation criteria.

