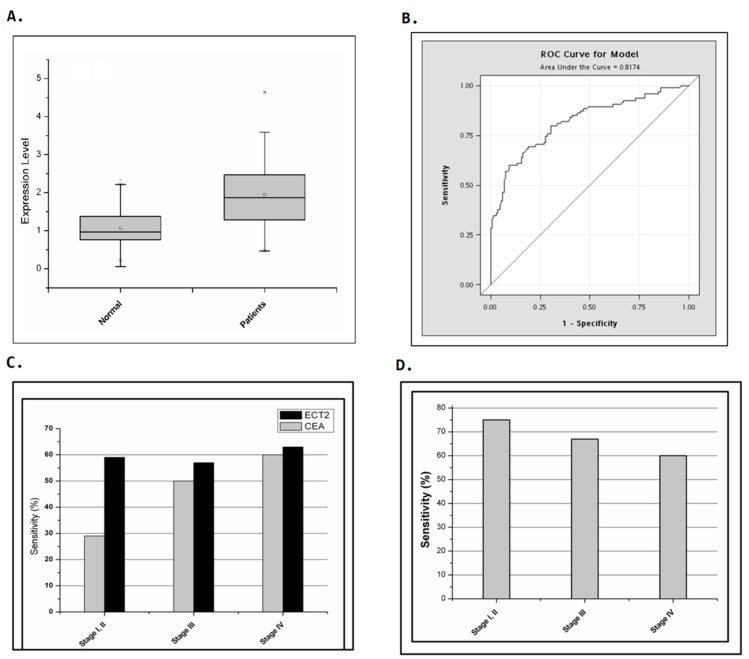
Figure 2.
Identification of ECT2 as a candidate marker gene for quantifying circulating tumor cells in colorectal cancer patients. Comparison of the detection sensitivity of CEA and ECT2, singly and in combination, as markers in colorectal cancer patients at different stages. (A) A box plot showing differential expression ratios of ECT2 in colorectal cancer patients and a normal control group. The p value of a two-tailed unpaired t-test was 1.42 × 10⁻¹⁵. The whiskers of the boxes indicate 1.5 interquartile range (IQR) of the lower and higher quartile. (B) Receiver operating characteristic (ROC) analysis of ECT2 expression in cells from peripheral blood of colorectal cancer patients and normal donors. The area under curve (AUC) was 0.821. (C) A total of 90 colorectal cancer patients were included in this study. CEA had a detection sensitivity of 29%, 50%, and 60%, while ECT2 had a sensitivity of 59%, 57%, and 63%, in patients with stage I/II, stage III, and stage IV cancers, respectively. (D) In patients with serum CEA lower than the diagnostic threshold of 5 ng/mL, the ECT2 quantification sensitivity in patients with stage I/ II, stage III, and stage IV were 75%, 67%, and 59%.

