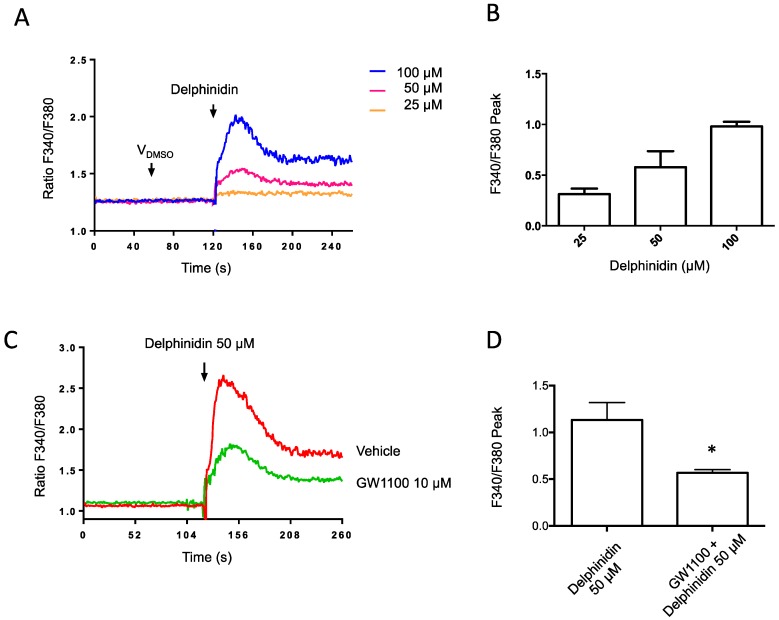
Figure 4.
Delphinidin increases intracellular Ca2+ concentration in HT-29 Fura-2 AM loaded cells. The changes in cytosolic calcium concentration were evaluated by spectrofluorimetric assays; (A) The representative fluorescence record of cytosolic calcium changes induced by delphinidin is depicted; (B) Mean data from dose-response experiments in HT-29 cells; (C) Intracellular calcium increases induced by delphinidin were inhibited with 10 μM GW1100 (FFA1 antagonist); (D) Comparison of the peak observed calcium response with and without FFA1 antagonist treatment. Bars represent mean ± SEM of 3–5 different experiments. * p < 0.05.

