Figure 7.
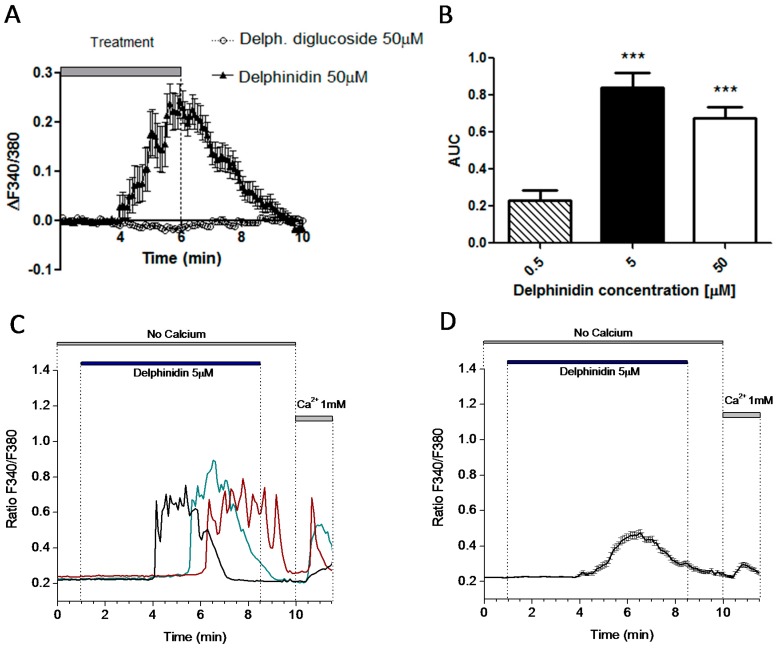
Delphinidin induces intracellular calcium oscillations and store-operated calcium entry in NCM460 Fura-2 AM loaded cells. (A) Representative recording (mean ± SEM) corresponding to 19 cells treated with either Delphinidin-3,5-glucoside (black triangles) or delphinidin (empty circles). The vertical symbols represent SEM; (B) Area-under-the-curve (AUC) data from dose-response experiments on NCM460 cells; (C) NCM460 cells in calcium-free medium were perfused with delphinidin. Each colored line represents calcium concentrations of a single cell. The horizontal bar depicts the duration of perfusion; (D) Mean data ± SEM from all cells in a representative experiment from at least 20 cells. *** p < 0.001.

