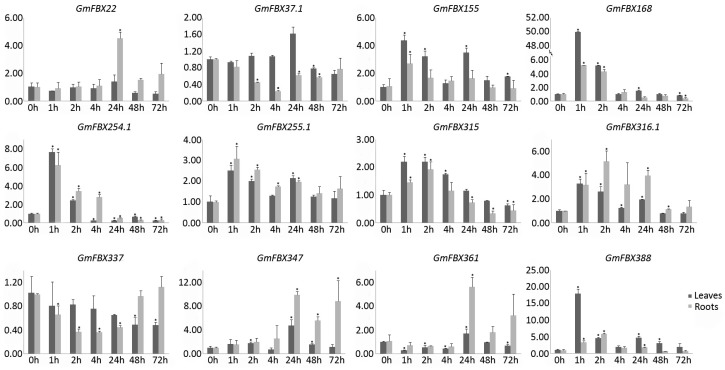
Figure 7.
Relative expression levels of 12 GmFBXs in response to salt stress. RNA was extracted from the leaves and roots of soybean at 0 h, 1 h, 2 h, 4 h, 24 h, 48 h and 72 h after a 0.9% NaCl treatment. The quantitative reverse-transcription polymerase chain reaction (qRT-PCR) data were normalized with GmELF1b and the gene expression levels relative to those at 0 h were shown. The error bars indicate standard deviations (t-test, * p < 0.05).

