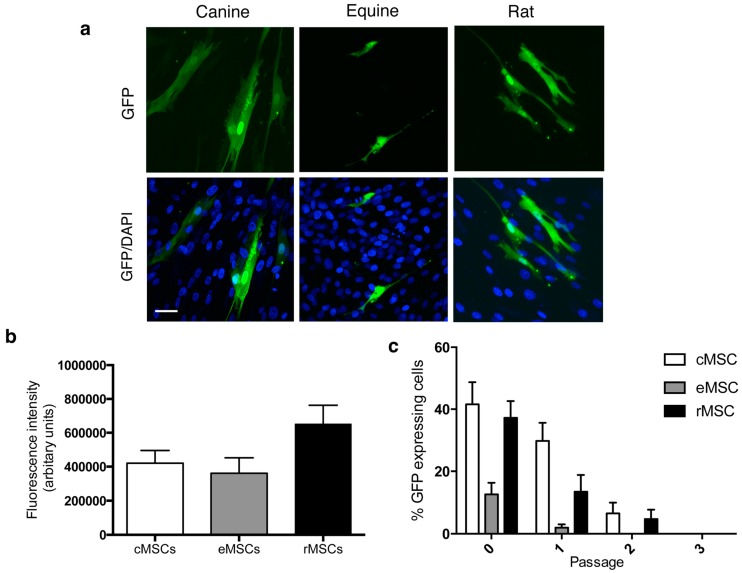
Figure 4.
(a) GFP expression was assessed in MSCs transfected with MC.CAG. (b) The average relative fluorescent intensity was similar between all three cell lines examined. (c) GFP expression decreased with passage and dilution of MC.CAG, with no GFP expression visible at passage 2 for equine MSCs and passage 3 for canine and rat MSCs. Data presented as mean ± SE. (n = 25 cells from three independent experiments). Scale bar = 50 μm.

