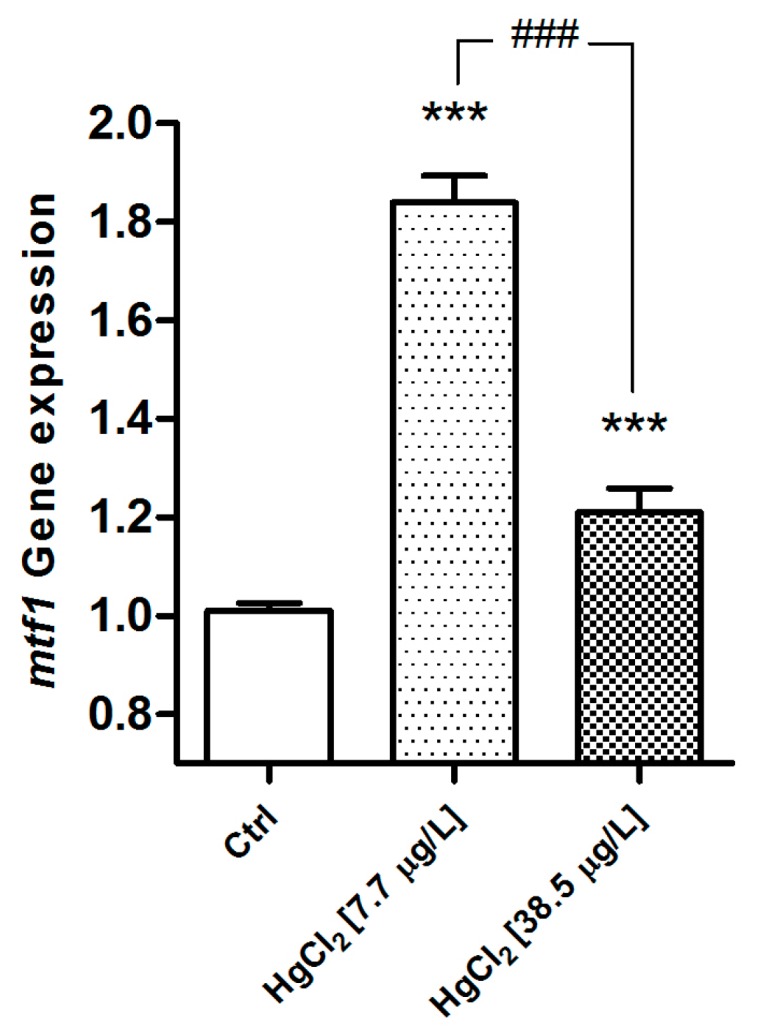
Figure 11.

Relative variations in mt gene expression in the gill apparatus of D. rerio in the basal condition and after 96 hours of exposure to HgCl2 (7.7–38.5 µg/L). Taqman real time relative quantitative PCR. The bars show mean ± S.D, n = 5. Asterisks indicate the treated groups that differ from the control, *** p < 0.001; hashtags indicate difference between treated groups ### p < 0.001 (One way ANOVA followed by Bonferroni’s post hoc test).
