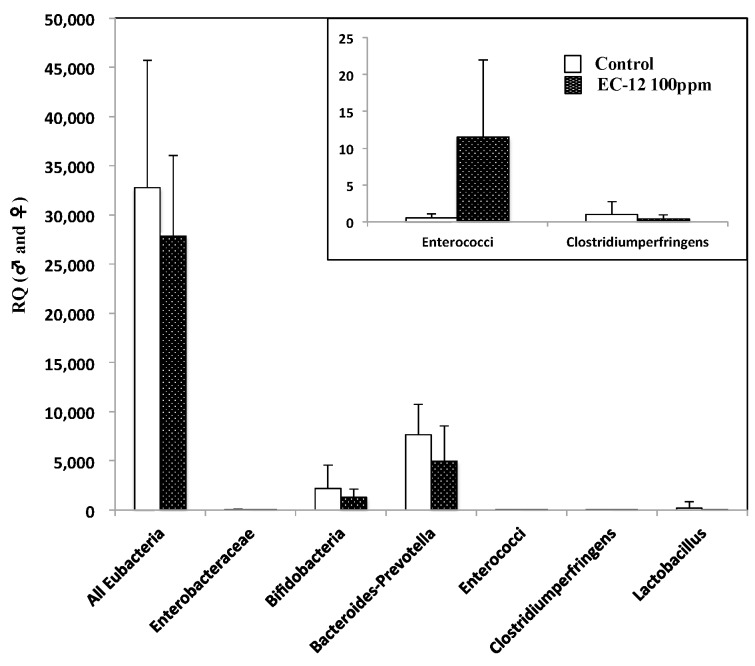
Figure 3.
Effect of EC-12 on enterobacterium in the feces of Min mice. Feces of five mice in each group were collected from the rectum of Min mice. The amount of the indicated bacterium was evaluated by quantitative real-time PCR analysis. The window shows an enlarged view of the Figure, especially the amount of Enterococci and the Clostridium perfringens group. Open column: control group; closed column: 100 ppm EC-12-treated group. Data are the mean ± SD (n = 5). RQ: relative quantification.

