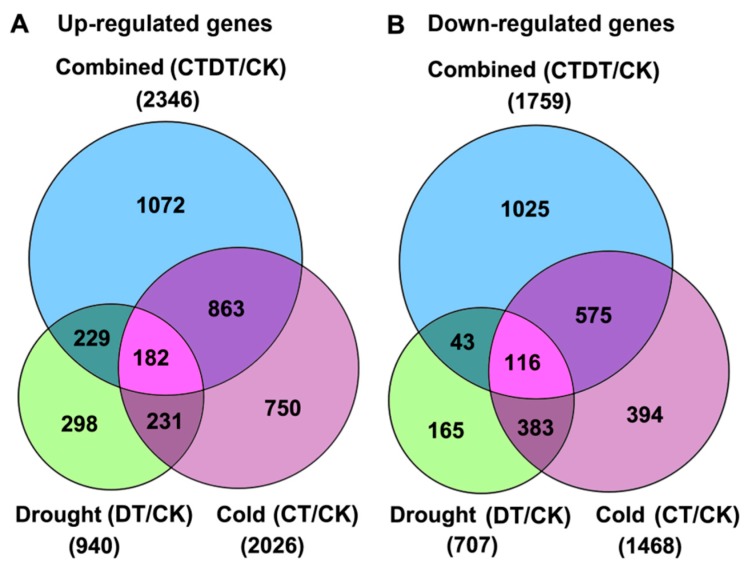
Figure 2.
Venn diagrams showing the number of differentially expressed genes (DEGs). The numbers of up-regulated (A) and down-regulated (B) genes in either cold-, drought-, or combined cold and drought-treated samples of D. spiculifolius seedling (compared to the control non-stressed plants) are shown. We used “false discovery rate ≤0.05 and the absolute value of log2Ratio ≥1” as the threshold to judge the significance of the differences in gene expression.

