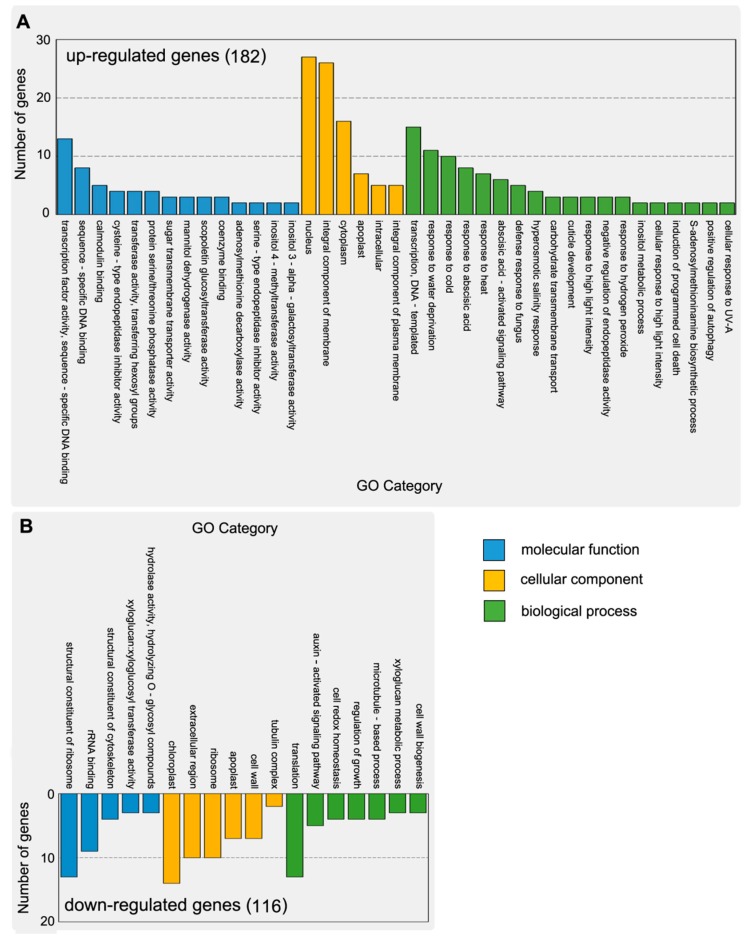
Figure 3.
Histogram of gene ontology (GO) classification of DEGs. (A) GO classification of up-regulated genes. (B) GO classification of down-regulated genes. The results are summarized in three main categories: biological processes (green), cellular component (yellow) and molecular function (blue). The y-axis on the left side indicates the number of DEGs.

