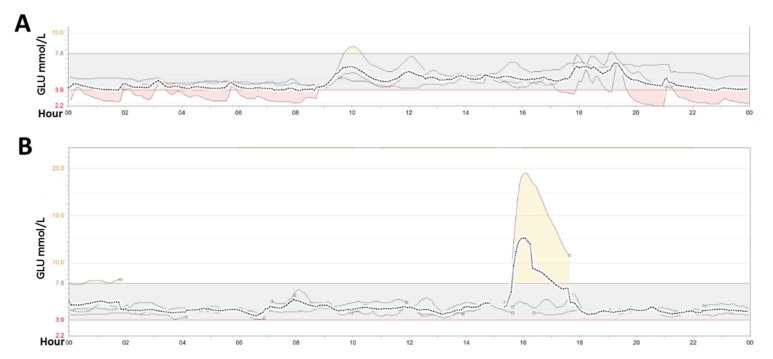
Figure 2.
The dynamic blood glucose monitoring results. The blood glucose range was continuously detected for three days by an audiomonitor (Minimed Paradigm 722, Medtronic). (A) Hypoglycemia (<3.9 mmol/L) of Case 2 mainly occurred from 8:00 pm to 8:00 am; (B) Though no hypoglycemia was detected in Case 4, he did not appear to have a high postprandial blood glucose peak, which could be induced by oral glucose intake (the peak in 16:00–18:00). The dashed line represents the mean value of glucose over three days. The three solid line represents the results of each day monitoring result, respectively. The small circle after the solid line means monitoring interruptions because of non-cooperation of the patient. GLU: glucose.

