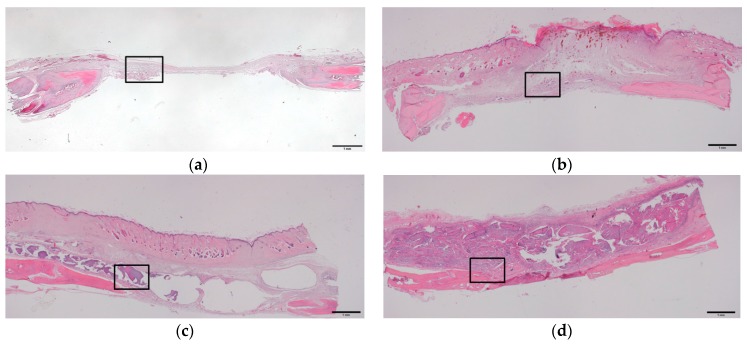
Figure 4.
Histological images (hematoxylin and eosin staining) at four weeks after operation. (a) unfilled defects from the control group (bar = 1 mm); (b) AL (bar = 1 mm); (c) AL/HA (bar = 1 mm); and (d) AL/HA/SF (bar = 1 mm) beads; (e–h) magnified views of the boxed areas in (a–d) (original magnification 100×, bar = 100 µm).


