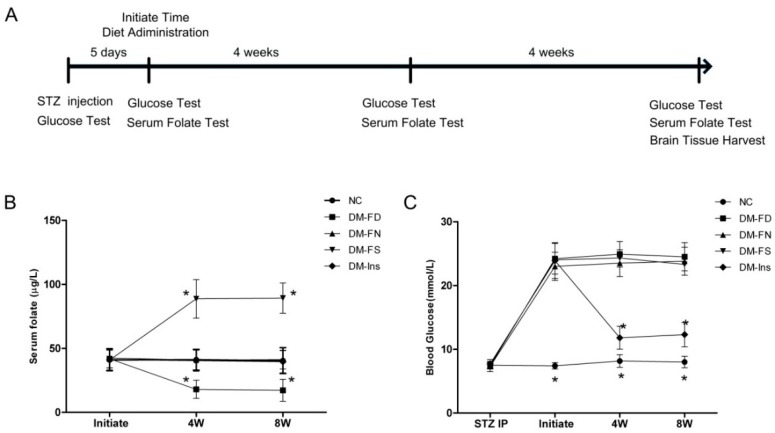
Figure 1.
Experimental timeline and results of serum folate and blood glucose level. Timeline depicting serum folate as well as blood glucose testing at baseline and every 4 weeks throughout the study (A); STZ-treated mice were divided into four groups: folate-deficient diet plus daily gavage with water (DM-FD); control diet plus daily gavage with water (DM-FN); control diet plus daily gavage with 120 μg/kg folic acid (DM-FS) and control diet plus daily gavage with water and insulin treatment (DM-Ins). Additionally, mice fed with the control diet and gavaged daily with water as normal control group (NC). Serum folate in STZ-treated mice was determined by an automated chemiluminescence system (B); Blood glucose in tail vein was tested by glucometer (C). Plotted are mean ± SD values, n = 11 animals/group. * p < 0.05 versus the DM-FN group. STZ, streptozotocin.

