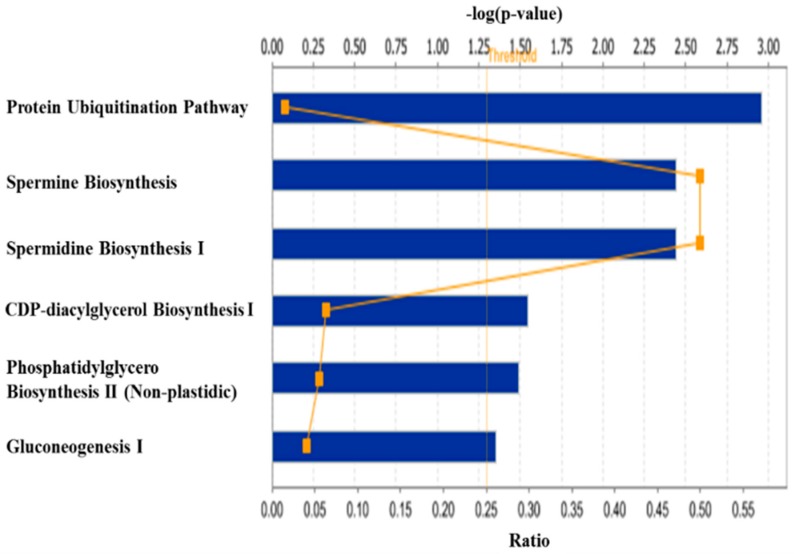
Figure 4.
Canonical pathways significantly affected (a “−log of p-value” ≥ 1.3) by dietary lysine excess in skeletal muscle of finishing pigs. The x-axis displays the significant pathways, and the y-axis displays the −log of p-value. Each rectangular symbol connected with other rectangular symbols by a line represents a ratio that is calculated as the number of genes in a given pathway that meet the defined cutoff criteria divided by the total number of genes in the reference gene set that make up that pathway.

