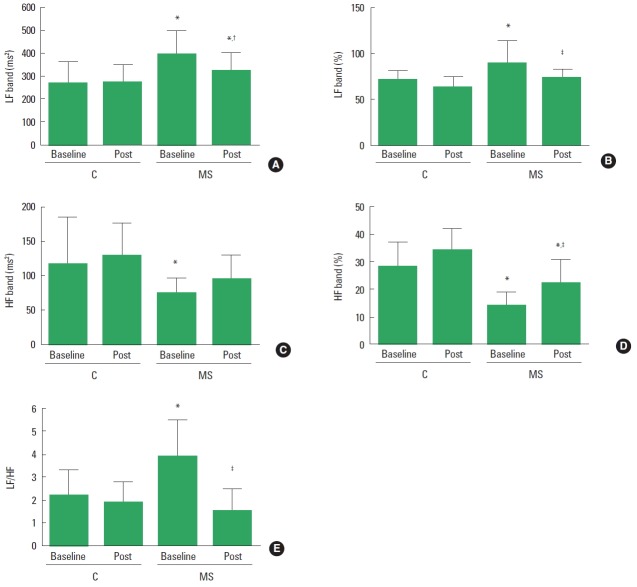
Fig. 2.
Heart rate variability in frequency domain in control and metabolic syndrome (MS) groups. (A) Absolute low frequency band. (B) Percent low frequency band. (C) Absolute high frequency band. (D) Percent high frequency band. (E) LF/HF ratio. HF, high frequency band; LF, low frequency band. *P<0.05 vs. control group at the same evaluation time. †P<0.05 vs. baseline in control group. ‡P<0.05 vs. baseline MS group.

