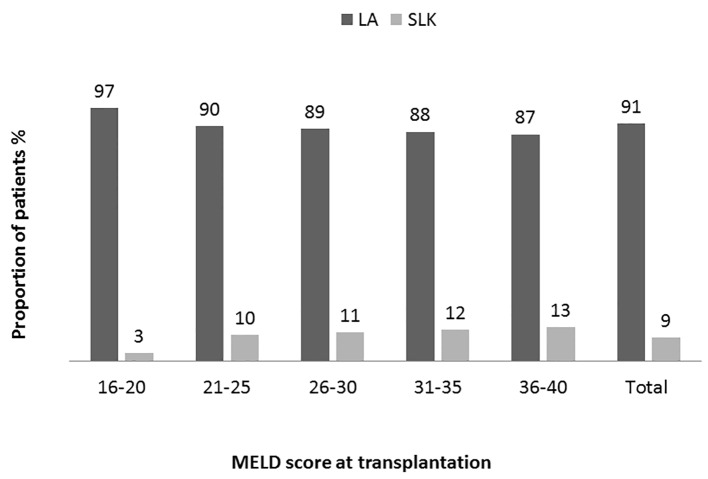
Figure 3.
Distribution of patients receiving transplantation base on MELD categories. Proportion of patients receiving simultaneous liver kidney (SLK) or liver alone (LA) transplant in each MELD group and in overall study population. A trend of increasing prevalence from low to high MELD groups (Pearson correlation R 0.11: P = 0.00001 (two-tailed)). Analysis of variance was used to determine the differences among the groups. High MELD group (MELD 36 - 40) is statistically significantly different (P ≤ 0.05) compared to other groups except MELD group 31 - 35 (P = 1.0).

