Figure 3.
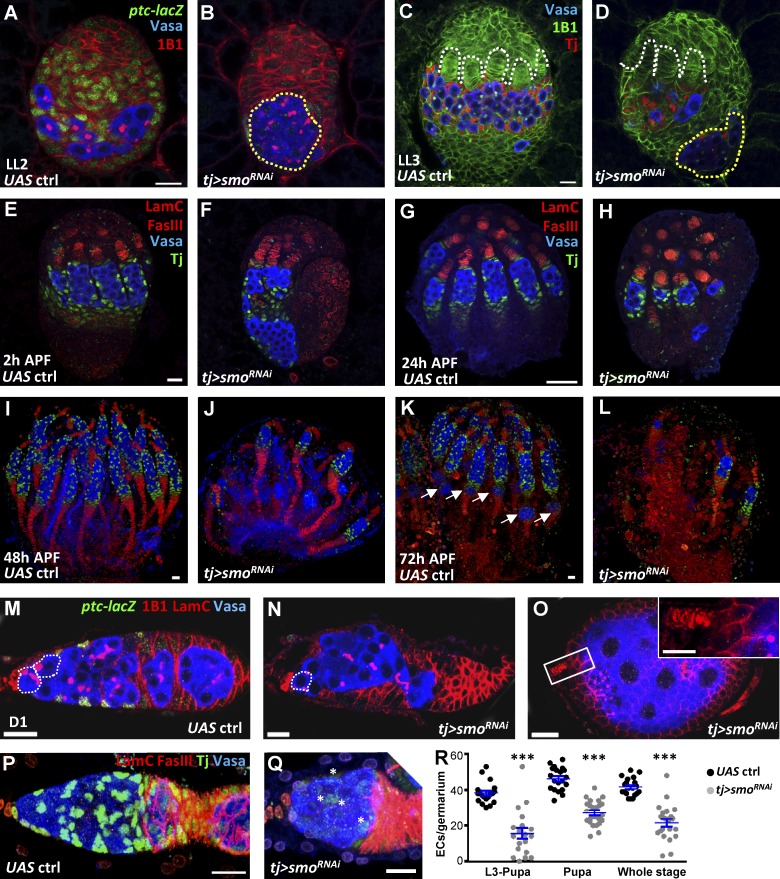
Somatic Hh signaling controls soma–germline interaction and GSC niche formation. (A–D) Control (ctrl; A and C) and tj>smoRNAi gonads (B and D) of late-L2 (A and B) and late-L3 (C and D) larvae with Vasa (blue, PGCs), 1B1 (red in A and B, green in C and D, fusomes and somatic cell membranes), ptc-lacZ in A and B (green, an Hh signaling reporter), and Tj in C and D (red, ICs). White dashed lines, TFs; yellow dashed circles, PGC clusters. (E–L) Control (E, G, I, and K) and tj>smoRNAi pupal ovaries (F, H, J, and L) with Vasa (blue), LamC (red, TF and cap cell nuclear envelopes), FasIII (red, stalk cell membranes), and Tj (green) at 2 (E and F), 24 (G and H), 48 (I and J), and 72 h (K and L) after puparium formation (APF). Arrows in K, newly formed egg chambers. (M–Q) One-day (D1) –old control (M and P) and tj>smoRNAi ovaries (N, O, and Q) with ptc-lacZ in M–O (green), Vasa (blue, germ cells), 1B1 in M–O (red, fusomes and follicle cell membranes), LamC (red), FasIII in P and Q (red, follicle cell membranes), and Tj expression in P and Q (green, cap, escort and follicle cell nuclei). The inset in O shows an empty germarium; asterisks in Q show escort cells with weak Tj expression. Dashed circles, GSCs. Bars, 10 µm. (R) Escort cell (EC) number per germarium of D1 control and flies with smo-knockdown driven by tj-GAL4 from L3 to pupal stages, during the pupal stage, or throughout development (whole stage). Statistical differences were analyzed by two-tailed t-test. Error bars represent SEM. ***, P < 0.001.

