Figure 5.
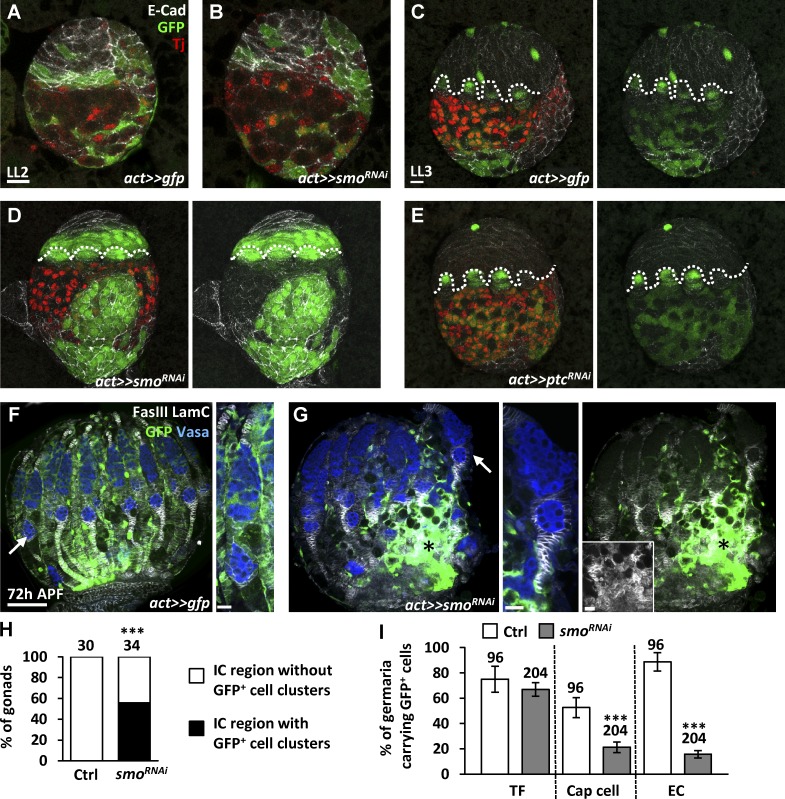
Somatic Hh signaling controls cell fate decision between stromal ICs and epithelial basal cells. (A–E) Control (act>>gfp; A and C), smo- (B and D), and ptc-knockdown (E) mosaic gonads with GFP (green, flip-out clones), E-cad (gray), and Tj expression (red, ICs) of late-L2 (A and B) and late-L3 larvae (C–E). Dashed lines mark forming TFs. (F and G) Mock control (F) and smo-knockdown mosaic pupal ovaries (G) with GFP (green, flip-out clones), Vasa (blue, germ cells), LamC (gray, TF and cap cell nuclear envelopes), and FasIII (gray, stalk cell membranes) 72 h after puparium formation (APF). F, right, and G, middle, are an enlarged view of the germarium in (F) and (G, arrows). The inset in G, right, shows only the irregular arrangement of GFP+ stalk cells from the region indicated by asterisks in G, left, and G, right. Bars: (A–E; F, right; G, middle; and G, right, inset) 10 µm; (F, left, and G, left) 50 µm. (H) Percentage of gonads with or without GFP+ cell clusters in the IC region of late-L3 mock control and smo-knockdown mosaic gonads. (I) Percentage of germaria carrying GFP+ TFs, cap cells, and escort cells (ECs) in control and smo-knockdown mosaic pupal ovaries at 72 h APF. Gonad or germaria numbers analyzed are shown above each bar. ***, P < 0.001. Statistical differences analyzed by χ2 in H and two-tailed t-test in in I. Error bars represent SD in I.

