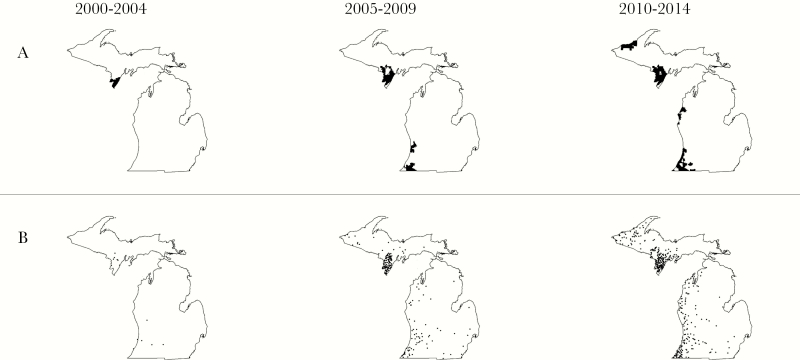
Figure 2.
(A) Sequential cluster analysis of Lyme disease cases, grouped by 5-year interval. Clusters of Lyme disease both expanded and appeared in the Upper and Lower Peninsulas throughout the study period. The underlying case data were initially aggregated annually at the zip code level based on the patient’s residential address. The cluster detection method incorporated zip code level population data and identified clusters where more cases were observed than would be expected under a Poisson distribution. (B) Cases of Lyme disease by county of acquisition. In this map, each case is represented by a dot placed randomly in the county where the infection was likely acquired.

