Fig. 2.

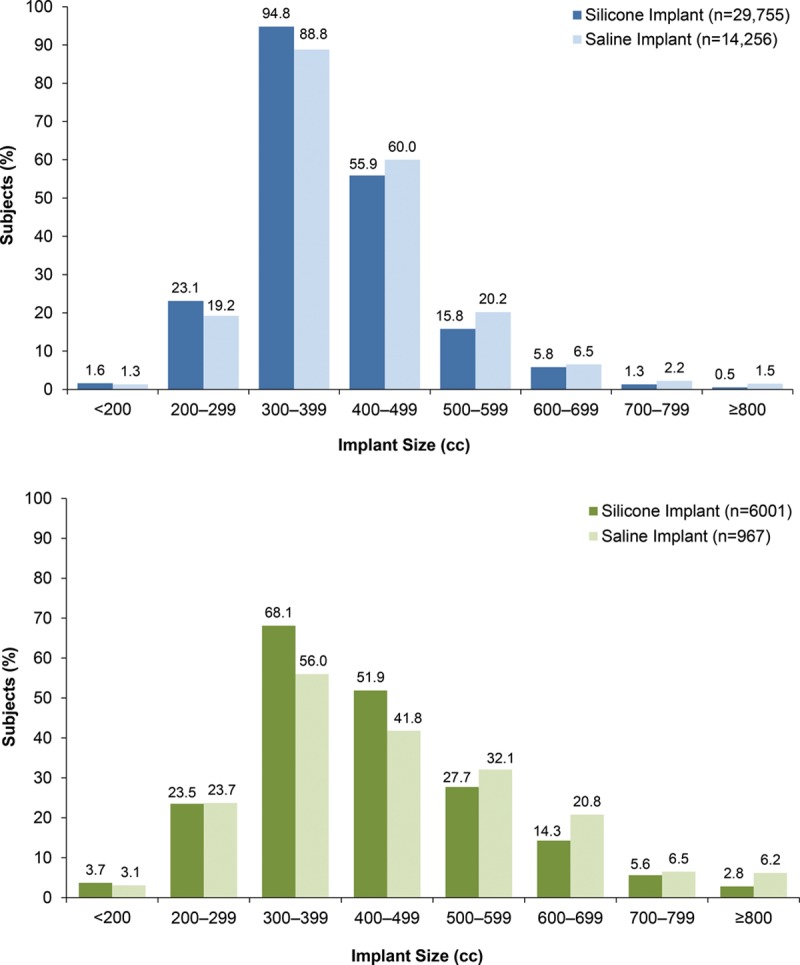
Implant size for primary augmentation (above) and revision-augmentation (below) subjects. Size distributions differed between the silicone and saline groups in both indications (both p < 0.0001).

Implant size for primary augmentation (above) and revision-augmentation (below) subjects. Size distributions differed between the silicone and saline groups in both indications (both p < 0.0001).