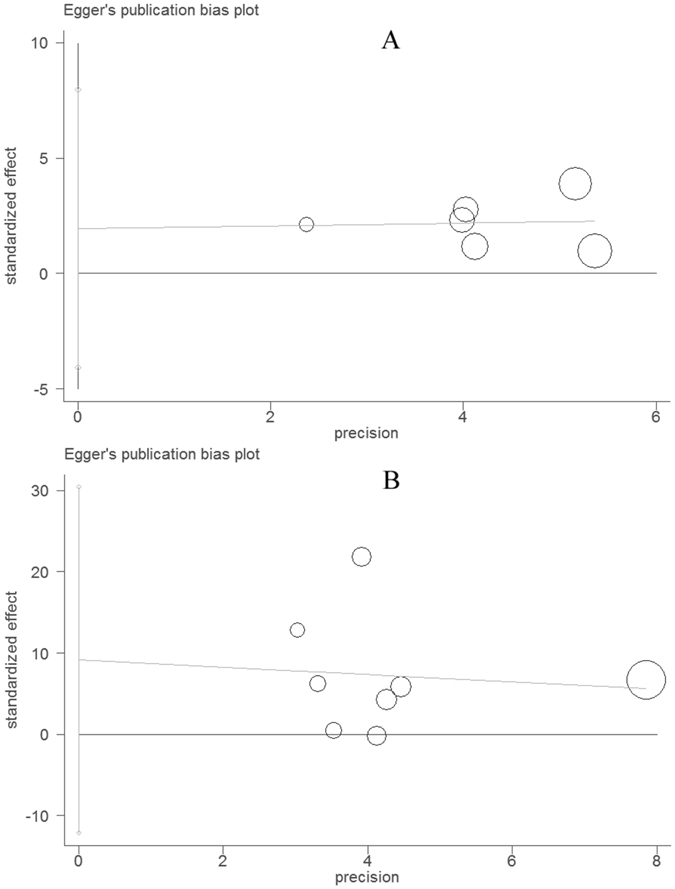
Figure 3.

Funnel plot for evaluating publication bias on the association between the PTB risk and MIF-173G/C gene polymorphism (A) as well as on the association between the serum MIF levels and PTB (B). Each circle represents a separate study for the indicated association.
