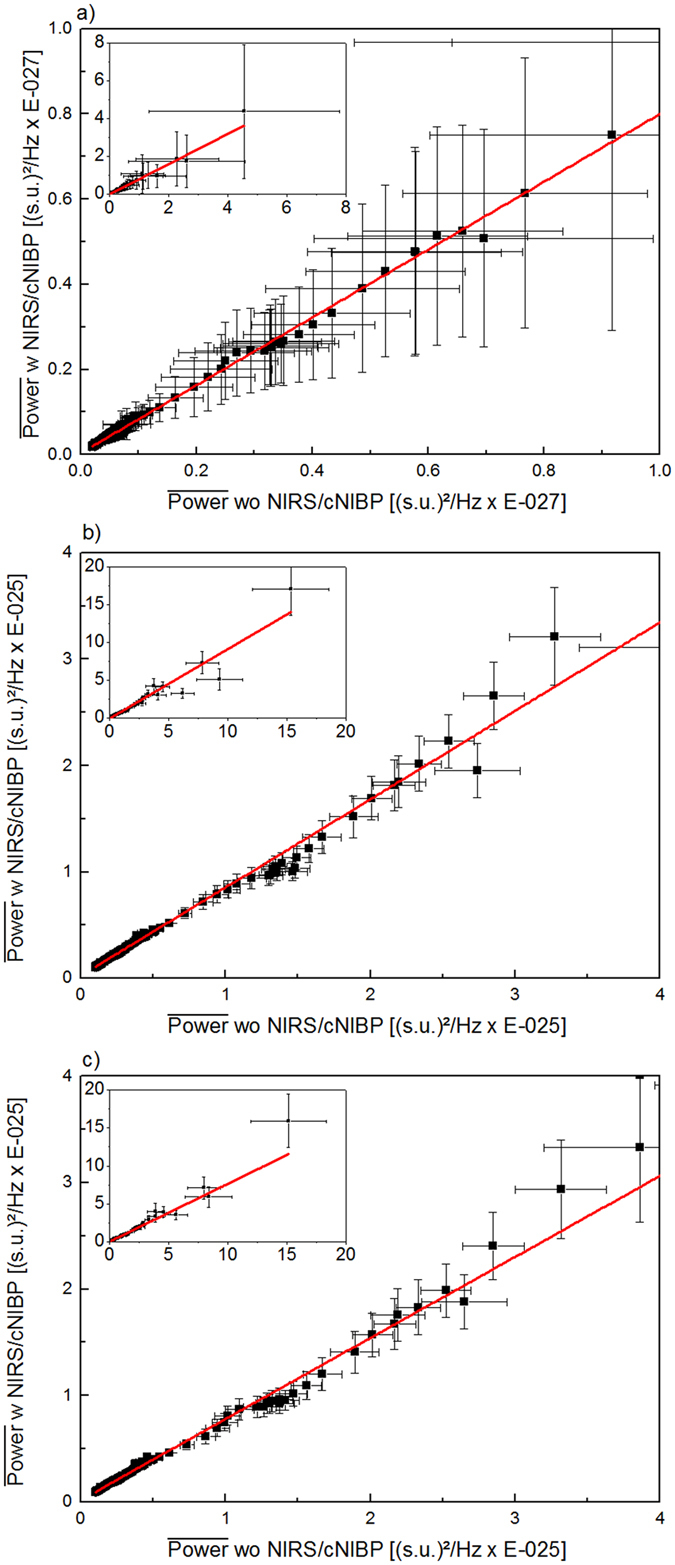
Figure 4.

Comparison of mean power values (black dots, whiskers = SD) measured with magnetometers (a) and planar gradiometers (b and c), with (x axis) and without (y axis) the multimodal setup. For better visualisation the plots show an extract of all data, which were shown in each inset separately. In all cases the data can be well explained by a linear fit (red line). Note the slight positive intercept of the linear fits due to smaller power values when the multimodal setup is applied. The external sensors for NIRS are attached on back of the head and on forehead above left eye. Sensors for cNIBP are attached on chest and neck (see Figure 1).
