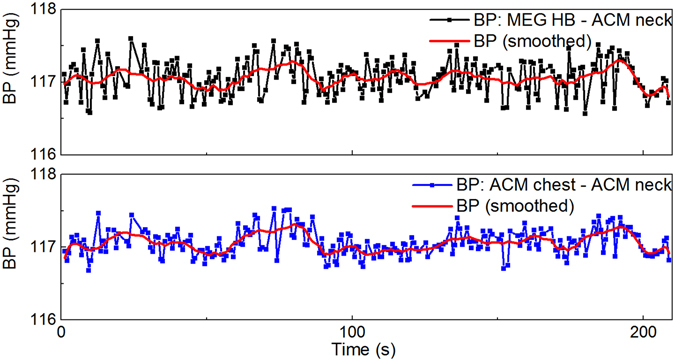
Figure 6.

A comparison of BP oscillations when using two PTT calculation methods simultaneously. In the upper plot, BP is based on the PTT calculation between when ACMs are placed on chest and neck. In the lower plot, PTT is between heart beats determined by MEG and ACM placed on neck. The values calculated for BP are not absolute, because the calibration procedure was omitted. Red curve shows averaged responses for PTT.
