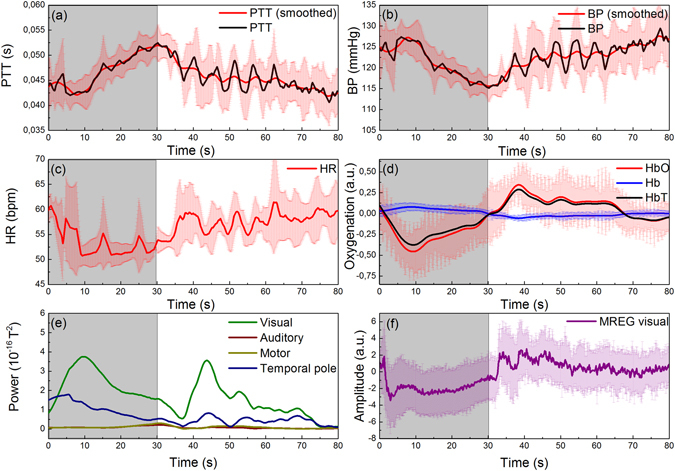
Figure 7.

Averaged responses for PTT (a), BP (b), HR (c) measured with the cNIBP device; HbO/Hb (d) measured with the NIRS device from back of the head and four scouts (MEG) covering visual (green line), auditory (brown line), motor (dark yellow line) and temporal pole (blue line) brain areas (e). Average for NIRS and cNIBP data was calculated using values obtained during 4 breath holding sequences. Vertical bars represent standard deviation of the values. In addition, (f) shows an averaged response of 8 breath holds using the same breath hold task but recorded independently with our MREG multimodal setup9. In all subfigures t = 0 marks the beginning of breath holding for 30 s, highlighted with grey area.
