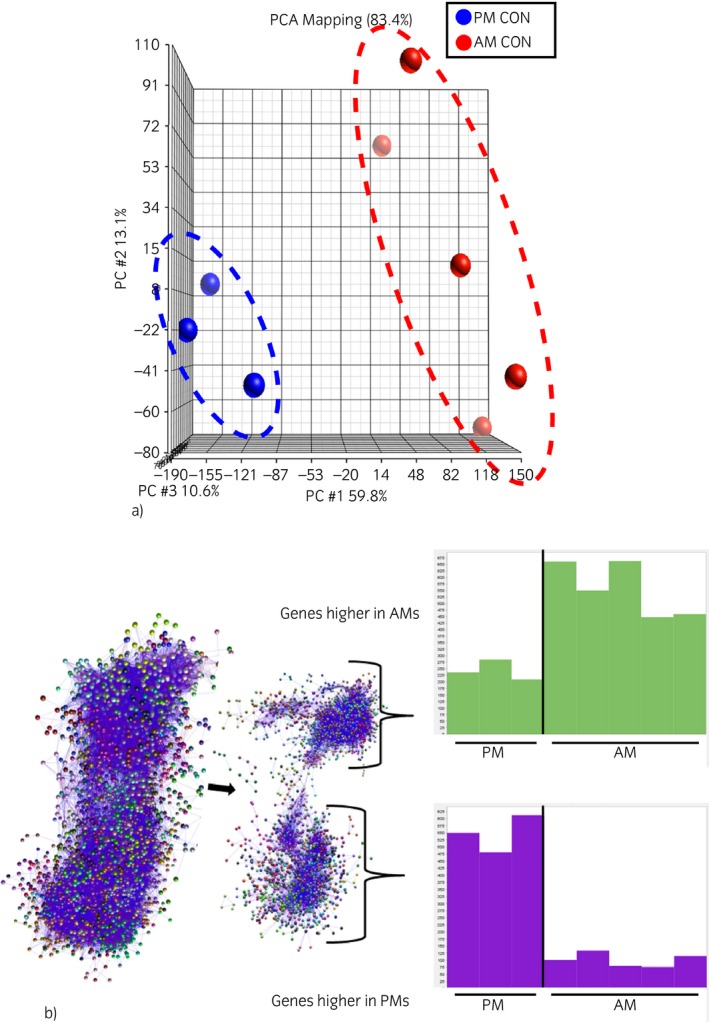
Figure 1.

Alveolar macrophages (AMs) and peritoneal macrophages (PMs) display different gene expression profiles at homeostasis. (a) Principal component analysis was conducted in 5 samples of AMs and 3 samples of PMs. (b) Network analysis of genes differentially expressed in AMs and PMs at homeostasis. The graph was generated by BioLayout Express3D software (MCL 2.2, r ≥ 0.93). Nodes with the same colour belong to the same cluster of coexpressed genes. The graphs at the right show expression profiles of genes expressed more highly in AMs and PMs, respectively. The x‐axis shows each horse and the y‐axis shows the normalised relative intensity of expression in that horse.
