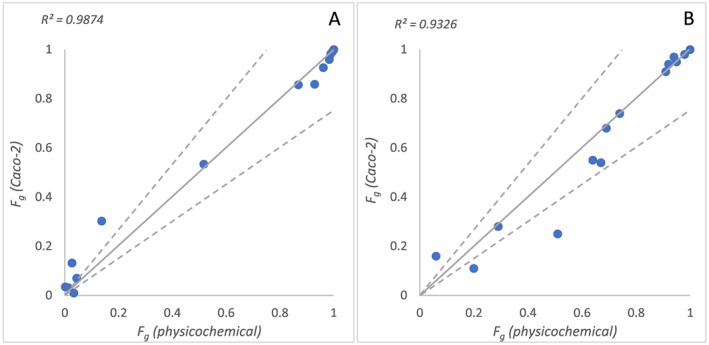
Figure 2.

Relationship between predicted F g using permeability data based on physicochemical properties and Caco‐2 data with human in vivo clearance in Q gut (A) or ADAM (B) models. Solid line represents line of unity, and dashed lines represent 1.5‐fold deviation from unity
