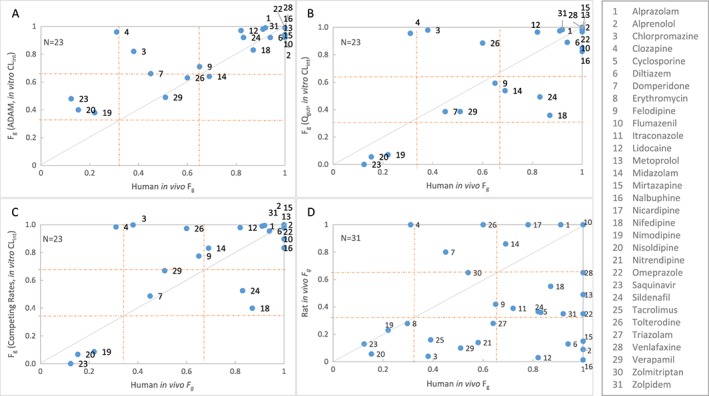
Figure 4.

Comparison of human in vivo F g vs predicted F g using in vitro HLM CL int in ADAM (A), Q gut (B) or Competing Rates (C) models and Rat model (D). Solid line represents line of unity. The dotted lines at 0.33 and 0.66 represent cut‐off values for categorization of low, medium and high F g
