Abstract
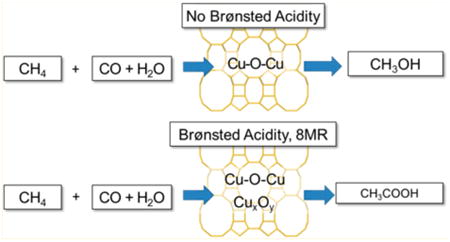
The selective low temperature oxidation of methane is an attractive yet challenging pathway to convert abundant natural gas into value added chemicals. Copper-exchanged ZSM-5 and mordenite (MOR) zeolites have received attention due to their ability to oxidize methane into methanol using molecular oxygen. In this work, the conversion of methane into acetic acid is demonstrated using Cu-MOR by coupling oxidation with carbonylation reactions. The carbonylation reaction, known to occur predominantly in the 8-membered ring (8MR) pockets of MOR, is used as a site-specific probe to gain insight into important mechanistic differences existing between Cu-MOR and Cu-ZSM-5 during methane oxidation. For the tandem reaction sequence, Cu-MOR generated drastically higher amounts of acetic acid when compared to Cu-ZSM-5 (22 vs 4 μmol/g). Preferential titration with sodium showed a direct correlation between the number of acid sites in the 8MR pockets in MOR and acetic acid yield, indicating that methoxy species present in the MOR side pockets undergo carbonylation. Coupled spectroscopic and reactivity measurements were used to identify the genesis of the oxidation sites and to validate the migration of methoxy species from the oxidation site to the carbonylation site. Our results indicate that the CuII–O–CuII sites previously associated with methane oxidation in both Cu-MOR and Cu-ZSM-5 are oxidation active but carbonylation inactive. In turn, combined UV–vis and EPR spectroscopic studies showed that a novel Cu2+ site is formed at Cu/Al <0.2 in MOR. These sites oxidize methane and promote the migration of the product to a Brønsted acid site in the 8MR to undergo carbonylation.
Graphical abstract
Introduction
The selective conversion of methane to liquid oxygenated compounds, such as methanol or dimethyl ether, is an attractive strategy for obtaining value-added chemicals from abundant natural gas resources. Reforming natural gas followed by Fischer–Tropsch synthesis is currently effective only at large scales. In order to reach methane reserves at remote locations or spread over large fields and to reduce unwanted emissions from flaring, alternative conversion pathways must be implemented at smaller scales.1 Low temperature oxidative routes for the activation of C–H bonds are thermodynamically and kinetically accessible. In nature, as in artificial systems, the key to selective methane oxidation is the ability to generate reactive oxygen species at metal active sites capable of attacking the strong C–H bonds of methane while avoiding overoxidation into carbon dioxide.
In enzymatic systems capable of converting methane into methanol, such as methane monooxygenases, iron2 and copper3 can generate electrophilic metal–oxygen species adept at attacking the strong C–H bonds of methane. Accordingly, numerous methane oxidation schemes have focused on the formation and reactivity of iron and copper–oxygen species in inorganic matrices. Most promising thus far are the iron-4 and copper-exchanged5 ZSM-5 zeolites, where FeIV = O6 and CuII –O—CuII species7 are believed to be key intermediates for the selective oxidation of methane to methanol. Both reactive centers oxidize methane into a surface bound methoxy group that is extracted as methanol by reacting with water. The pioneering work by Sels, Schoonheydt, and Solomon showed that methane oxidation in copper-exchanged ZSM-5 (Cu-ZSM-5) occurs via hydrogen abstraction by a bent mono-(μ-oxo) dicupric core to form both a methyl radical and a CuI–OH–CuII intermediate, which then combine through a rebound mechanism to form a bound methoxy species on a copper center.7c Oxidation activity is observed only for materials with Cu/Al molar ratios > 0.2, which is the minimal metal content requirement to form the mono-(μ-oxo) dicupric cores. To date, it is not clear if the methyl radicals rebound onto the same reactive center to form a metal-methoxy species,7c if they travel to another metal center,8 or if the methoxy species readsorbs elsewhere on the zeolite framework.
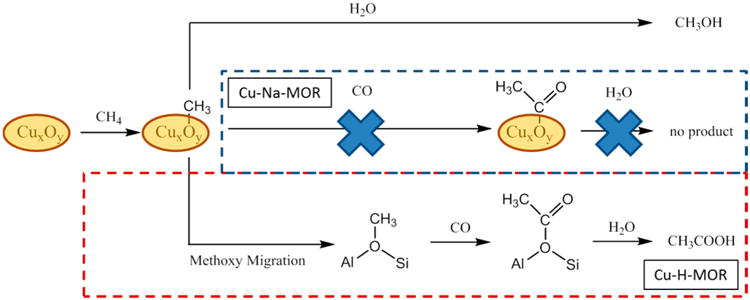
In this work, the conversion of methane to acetic acid is demonstrated in copper-exchanged mordenite (Cu-MOR) using a tandem oxidation/carbonylation reaction sequence. Notably, the carbonylation reaction serves as a site-specific probe capable of identifying the location of methoxy groups within the zeolite, thereby providing important mechanistic insight for methane oxidation. Bhan et al. demonstrated that the carbonylation of methoxy species generated from the interaction of methanol or dimethyl ether with an acid site occurs preferentially in the eight-membered rings (8MR) side pockets of MOR and ferrierite.9 Roman–Leshkov et al. confirmed the same trend in carbonylation reactivity by synthetically placing framework aluminum sites within the 8MR pockets of ferrierite.10 Corma and co-workers showed computationally that the carbonylation rates are further enhanced by spectator copper(I) ions that facilitate CO attack on surface methoxy species in the 8MR pockets.11 After the oxidation/carbonylation sequence, we show that Cu-MOR generates drastically higher amounts of acetic acid when compared to Cu-ZSM-5 under identical conditions (vide infra). We hypothesize that the oxidation-active copper species are responsible of converting methane into methoxy species, while the acid sites located in the 8MR pockets convert methoxy species into acyl groups in the presence of CO (see Scheme 1). Given that methoxy species bound onto copper sites are unlikely to react with CO, we posit that the production of acetic acid requires the migration of methoxy groups to a carbonylation active Brønsted acid site. To support this hypothesis, we present reactivity investigations using preferential titration and 13C- and 18O-labeled molecules coupled with spectroscopic and nuclear magnetic resonance (NMR) characterization studies. Our results show that, although some Cu sites in Cu-MOR are carbonylation active, acetic acid is mainly obtained by migration of methoxy groups into the 8MR pocket of H-MOR. Specifically, preferential titration experiments indicated that the amount of acetic acid produced was proportional to the number of Brønsted acid sites in the 8MR pockets. NMR and mass spectroscopy (MS) experiments using 13C- and 18O-labeled molecules confirmed that the intermediate species for carbonylation was a methoxy species localized on a Brønsted acid site. In addition, ultraviolet– visible (UV–vis) spectroscopic studies on Cu-MOR showed that the bent mono-(μ-oxo) dicupric species typically associated with the oxidation-active sites of Cu-Na-ZSM-55b–d,7c,12 and Cu-Na-MOR8,13 was not active for carbonylation. For samples prepared from the acid form of the zeolite and with Cu/Al < 0.2, the characterization data suggest the presence of an alternative oxidation site in Cu-H-MOR that is responsible for methane oxidation and subsequent methoxy migration.
Scheme 1. Methane Oxidation and Carbonylation over Cu-MOR Exchanged from Acid or Sodium Precursors.
Results and Discussion
Reactivity Studies
Tandem methane oxidation–carbonylation reaction sequences were investigated on Cu-MOR as a function of copper and acid content. Methane oxidation over Cu-MOR (Cu/Al = 0.36, Na/Al = 0.37) was first tested by activating the zeolite at 823 K under O2 flow, cooling to 473 K under Ar, and flowing methane for 0.5 h. Deuterium oxide extraction yielded 12.3 μmol/gcat of methanol, which is in agreement with previous extraction yields reported by Sels et al.5b (11 μmol methanol/gcat from Cu-Na-MOR with Cu/Al = 0.43) and Alayon et al.8 (13 μmol/gcat methanol from Cu-Na-MOR at Cu/Al = 0.38).
Methane oxidation was coupled with carbonylation by flowing CO at 1000 kPa and 473 K immediately after oxidizing methane over the activated zeolite under strictly anhydrous conditions. In Cu-MOR, carbonylation of surface methoxy species14 may occur in three different locations: in acid sites located in the 8MR pockets, in acid sites in the 12MR main channel, and in copper-exchanged sites in both pore systems.14,15 Bhan and co-workers demonstrated that methoxy species formed in the 8MR pockets of H-MOR are the most carbonylation active,9a while those in the main channel undergo carbonylation at much lower rates and preferentially decompose into hydrocarbons above 473 K.9d Importantly, carbonylation activity within Cu-MOR and H-MOR can be modulated by partially exchanging acid sites with sodium, which has been shown to preferentially titrate the Brønsted acid sites in the 8MR pockets over those in the 12MR.9a Following this approach, we investigated the carbonylation of oxidized methane products as a function of Brønsted acid site content at a constant Cu/Al ratio of 0.20–0.25 (Figure 1). Deuterium oxide extraction showed that the parent Cu-MOR (Cu/Al = 0.20 and H/Al = 0.5) generated 22.9 and 24.1 μmol/gcat of acetic acid and methanol, respectively (Figure 1). As the acid sites in the 8MR pockets were progressively titrated from an H/Al of 0.4 to 0.27, acetic acid production decreased from 18.5 to 12.3 μmol/gcat. These extraction levels persisted until almost all of the Brønsted acid sites were titrated, at which point the acetic acid production decreased to 6.0 μmol/gcat. These data translate to an acetic acid production from copper sites, acid sites in the 12MR, and acid sites in the 8MR of 6.0, 6.5, and 10.5 μmol/gcat, respectively. A total exchange of acid sites was not achieved because, as observed by the groups of Bell,17 Hall,18 and Gorte,16c Brønsted acid sites are always produced when copper is exchanged into Na-exchanged zeolites. On the basis of the observed dependence of carbonylation activity on Brønsted acid site content within Cu-MOR with Cu/Al < 0.2, the acetic acid yield would be expected to approach 6.0 in the absence of any Brønsted acidity. Note that as the copper content in Cu-Na-MOR was increased above Cu/Al of 0.33, the carbonylation activity was completely quenched.
Figure 1.
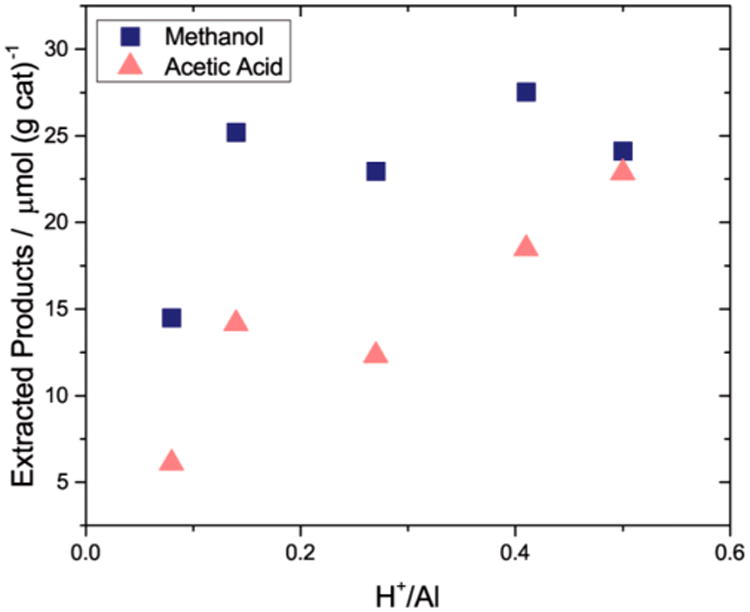
Methane oxidation and subsequent carbonylation on Cu-H-MOR at Cu/Al = 0.20–0.25. Methane oxidation conditions: Activation at 823 K under O2, reaction T = 473 K, reaction time = 0.5 h.Carbonylation conditions: T = 473 K, carbonylation time = 0.5 h, PCO = 1000 kPa[H+] was calculated from a propylamine desorption method as described in previous studies (Supporting Information, Table S1).16 [Al3+] was calculated from elemental analysis using inductively coupled plasma atomic emission spectroscopy (ICP-AES).
To directly measure the amount of organic carbon present in the zeolite after reaction, Cu-MOR samples were dissolved in hydrofluoric acid (HF) and the solution was analyzed with quantitative 1H NMR. The total organic content from the zeolites changed significantly as a function of Brønsted acid content. The total amount of products on Cu-H-MOR and Cu-Na-MOR was 60.9 and 22.0 μmolcarbon/gcat, respectively (Table S7). The ratio of deuterium oxide–extracted methanol and acetic acid to the total carbon content obtained via HF dissolution was 0.55 and 0.70 for Cu-H-MOR and Cu-Na-MOR, respectively. Although the amount of deuterium oxide-extracted organics from this Cu-H-MOR sample was slightly lower than that calculated for a replicate experiment with the same zeolite (Table S7, see Figure 5), the variability in extraction was within the deviation previously found in Cu-ZSM-5.5b,c Overall, extraction efficiencies and total carbon contents are in line with those previously calculated for Fe–H-ZSM-519 and Cu-Na-ZSM-5 (Cu/Al = 0.58).5c The extraction efficiency could be increased by utilizing other solvent combinations, such as 10% (v) water/acetonitrile, but the overall change in extracted products would be small.19 More importantly, we note that the ratio of acetic acid to methanol calculated from the deuterium oxide-extracted products and from the HF dissolution method is nearly identical for Cu-Na-MOR and slightly higher for Cu-H-MOR (1.40 vs 1.08). Since extraction in water appears to marginally favor acetic acid, the relative amount of acetic acid is overestimated in the deuterium oxide-extracted values and the differences in product distribution observed for Cu-H-MOR and Cu-Na-MOR are thereby caused by the lack of carbonylation activity in the sodium sample and not because of selective extraction of methanol over acetic acid. Taken together, these data suggest that the number of active Cu sites is larger in Cu-H-MOR than in Cu-Na-MOR at similar Cu/Al ratios, assuming a 1:1 stoichiometry between active sites and products generated. The data are also in agreement with previous reports by Bhan and co-workers showing that for stop-flow carbonylation reactions of dimethyl ether on partially sodium exchanged H-MOR, lower levels of both acetic acid and total organic carbon are obtained when the Na/Al ratio is increased (Figure S11).9a,14b
Figure 5.
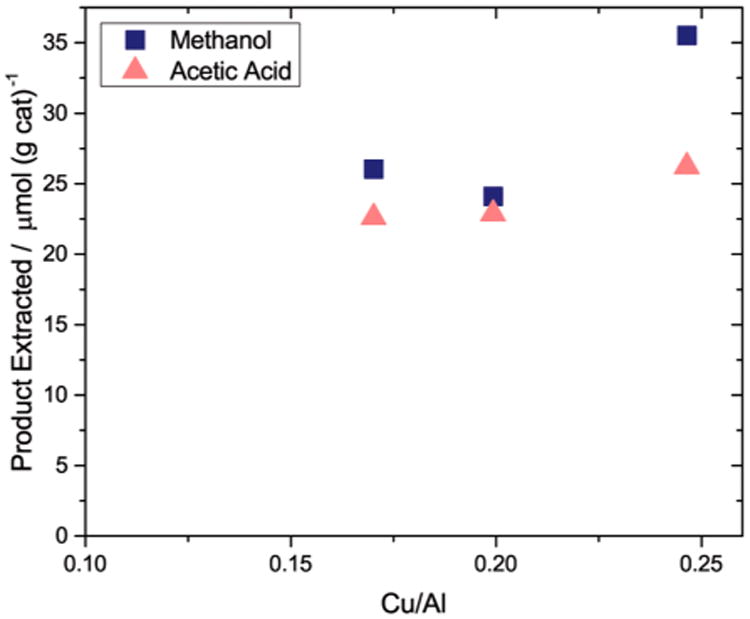
Methane oxidation and carbonylation on Cu-H-MOR with varying copper content.Methane oxidation conditions: Activation at 823 K under O2, reaction T = 473 K, reaction time = 0.5 h.Carbonylation conditions: T = 473 K, carbonylation time = 0.5 h, PCO = 1000 kPa.
For comparison, control methane oxidation/carbonylation reaction sequences were performed over Cu-ZSM-5. Although carbonylation products were detected, the amount of acetic acid in Cu-ZSM-5 was drastically lower when compared to that obtained with Cu-H-MOR. Specifically, methane oxidation/carbonylation on Cu-H-ZSM-5 generated only 4 μmol/gcat of acetic acid out of 12 μmol/gcat of total oxygenates. Proportionally, the methanol to acetic acid ratio produced by Cu-H-ZSM-5 was similar to that from a Cu-MOR zeolite without Brønsted acid sites in the 8MR pockets (i.e., ca. 50% Na exchange or H/Al = 0.14), showing that acid sites in the 8MR pockets are necessary to obtain high acetic acid yields. We note that Cu-Na-ZSM-5 failed to produce acetic acid (Figure 2). Bhan and co-workers had shown that the rate of dimethyl ether carbonylation in H-ZSM-5 was negligible compared to the rate in H-MOR due to the lack of 8MR side pockets to stabilize the acetyl intermediate.9a In batch reactions of dimethyl ether carbonylation over H-ZSM-5, acetic acid was produced but in very small amounts (0.02 mol acetic acid/mol Al, Figure S12). On the basis of these results, we surmise on the one hand, that the oxidation-active mono-(μ-oxo) dicupric site typically formed in Cu-Na-ZSM5 under these conditions is carbonylation inactive; and on the other, that the methoxy species in Cu-H-ZSM-5 generated after the oxidation step have either migrated to Brønsted acid sites or a different copper site is formed in the presence of Brønsted acid sites that is active for both oxidation and carbonylation.
Figure 2.
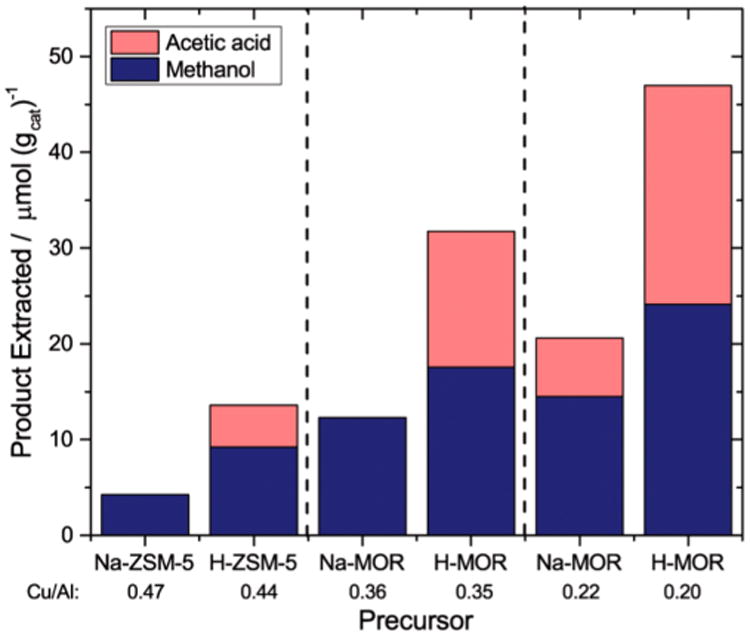
Methane oxidation and subsequent carbonylation on Cu-ZSM-5 and Cu-MOR exchanged from sodium and acid precursors.Zeolite precursors and Cu/Al contents are listed for each zeolite.Methane oxidation conditions: Activation at 823 K under O2, reaction T = 473 K, reaction time = 0.5 h.Carbonylation conditions: T = 473 K, carbonylation time = 0.5 h, PCO = 1000 kPa.
To verify the origin of methoxy species undergoing carbonylation, Cu-MOR and Cu-ZSM-5 were activated under 18O2 before reacting with methane (see Table S3). Previously, Sels et al. had shown that 18O2 activation of Cu-Na-ZSM-5 followed by methane oxidation generated methanol with 75% 18O enrichment, thus demonstrating that the oxygen from the mono-(μ-oxo) dicupric site became part of the methoxy group of methanol.5b Analysis of water-extracted methanol from Cu-H-ZSM-5 showed that enriched CH3 18OH constituted only 4.6%. Similarly, the percentages of CH3 18OH extracted from Cu-H-MOR and Cu-Na-MOR were 0.6 and 34%, respectively. In both cases, these values show a large decrease in 18O content when acid sites are present in the zeolite. To exclude the possibility of isotopic scrambling by interaction of Me18OH with acid sites during extraction, an aqueous CH3 18OH solution was mixed with Cu-H-MOR (Cu/Al = 0.17) at room temperature for several hours. The resulting solution contained 92.2% CH3 18OH (Table S4), indicating that no significant 18O isotopic scrambling occurred when mixing labeled methanol in the presence of acid sites at conditions analogous to those of the water-extraction process. These results are in agreement with previous experimental and theoretical investigations showing the lack of interaction of methanol with acid sites in zeolites at room temperature.20 These data suggest that the oxygen in the oxidation-active copper site is not incorporated into the extracted methanol product when Brønsted acid sites are present.
The migration of the methoxy species from the copper sites to acid sites after methane oxidation was investigated with 13C magic-angle spinning nuclear magnetic resonance (MAS NMR). As shown in Figure 3, three resonances are observed after reacting 13CH4 on activated Cu-H-MOR (Cu/Al = 0.20, H/Al = 0.50), which are assigned to physisorbed methanol (53.4 ppm), methoxy species on Brønsted acid sites (55.9 ppm),11 and methoxy species on a copper site (61.2 ppm, see Table S6, Figure S7 for justification). After carbonylation with 13CO, the resonance at 55.9 ppm decayed with the concomitant appearance of resonances at 21.5 and 188.5 ppm, which are associated with the methyl and carbonyl functional groups of acetic acid. A similar trend was observed for Cu-H-MOR with a higher copper content (Figure S4). In contrast, Cu-Na-MOR (Cu/Al = 0.36, Na/Al = 0.33) only featured resonances at 53.4 and 61.2 ppm after the methane oxidation step and did not feature resonances associated with acetic acid after the carbonylation step (Figure S5). These data offer strong evidence that the reaction intermediate undergoing carbonylation in Cu-H-MOR is a methoxy species on a Brønsted acid site.
Figure 3.
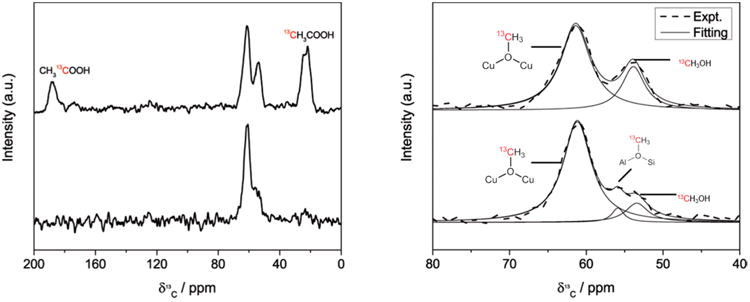
13C[1H] cross-polarization (CP) MAS NMR spectra of Cu-MOR (H-MOR precursor, Cu/Al = 0.20) after 13CH4 oxidation (bottom spectrum) and after 13CH4 oxidation and 13CO carbonylation (top spectrum). (Left) Full 13C[1H] CP MAS NMR spectra of Cu-H-MOR (Cu/Al = 0.20) after reaction with 13CH4 (bottom) and 13CH4 + 13CO (top). (Right) Enlarged spectral region containing methoxy resonances, with assignments.Simulated Lorentzian peaks (solid) are shown below the experimental spectra (dashed).
Characterization Studies
The speciation of copper centers in Cu-MOR with varying Cu/Al and H/Al ratios was investigated with ultraviolet–visible (UV–vis) spectroscopy (Figure 4) for samples that were treated first under Ar at 823 K, then under O2 at 823 K, and finally under methane at 473 K. Heat treating Cu-H-MOR (Cu/Al = 0.2 and Na/Al = 0.03) under Ar generated a broad peak centered at 13 300 cm−1 and a small shoulder at 16 700 cm−1 (Figure 4A). These bands have been previously characterized as the d–d transitions of square pyramidal and square planar Cu2+ species coordinated to the zeolite frame-work.21 After the O2 treatment, the intensity of the 13 300 cm−1 and 16 700 cm−1 bands decreased to reveal a band at 12 500 cm−1 and a broad shoulder at 9600 cm−1. For both Cu-Na-MOR samples, analogous visible-near-infrared (NIR) bands were observed upon Ar and O2 heat treatments. The d–d transitions at 13 600 cm−1 and 16 750 cm−1 featured reduced visible-NIR intensities after calcination. In contrast to Cu-H-MOR, the Cu-Na-MOR sample at Cu/Al = 0.36 featured a strong band at 22 200 cm−1 (Figure 4C), while both Cu-Na-MOR samples did not possess the band at 12 500 cm−1 (Figure 4B–C). Additionally, a very small shoulder at 9600 cm−1 was observed in Cu-Na-MOR (Cu/Al = 0.22) compared to the large shoulder in Cu-H-MOR.
Figure 4.
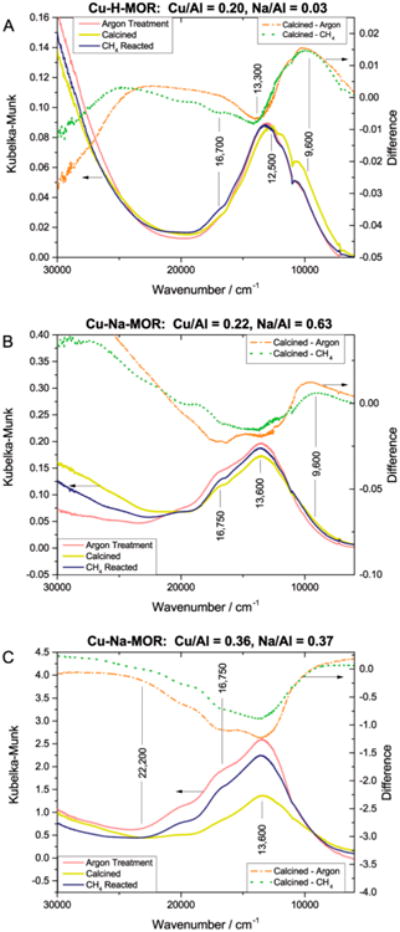
Diffuse Reflectance UV–visible spectra of (A) Cu-H-MOR (Cu/Al = 0.20, Na/Al = 0.03), (B) Cu-Na-MOR (Cu/Al = 0.22, Na/Al = 0.63), and (C) Cu-Na-MOR (Cu/Al = 0.36, Na/Al = 0.37).Zeolites were dried under argon at 823 K for 3 h (pink), calcined under oxygen at 823 K for 5 h (dashed gold), and reacted under CH4 at 473 K for 2 h (navy).Difference spectra (calcined–argon, dash-dot orange; calcined– CH4, dotted green) are shown.
A different redox behavior was observed after reacting methane over Cu-H-MOR or Cu-Na-MOR. For Cu-H-MOR, the d–d transitions at 9600 cm−1 and 12 500 cm−1 decayed while the transitions at 13 300 cm−1 and 16 700 cm−1 were regenerated (Figure 4A). Taken together, these spectra show how the sites represented by the bands at 12 500 cm−1 and 9600 cm−1 in Cu-H-MOR were created after high temperature activation under O2 and were consumed after reaction with methane. Unlike Cu-H-MOR, the 22 200 cm−1 band in Cu-Na-MOR (Cu/Al = 0.36) decayed after reaction with methane (Figure 4C). Additionally, the 12 500 cm−1 band did not appear after calcination of either Cu-Na-MOR zeolite, but it did appear in Cu-H-MOR. Reaction with methane caused a very small decay in the shoulder at 9600 cm−1 in Cu-Na-MOR (Cu/Al = 0.22, Figure 4B), along with the restoration of the 13 600 and 16 750 cm−1 bands in both Cu-Na-MOR samples (Figure 4B–C). Thus, the appearance of the methane oxidation active 9600 cm−1 band was unique to Cu-MOR samples with at least trace amounts of Brønsted acidity and carbonylation activity.
The exact nature of the methane oxidation active 9600 cm−1 band in Cu-H-MOR is still unknown. Sels and co-workers have observed a similar shoulder at 9200 cm−1 in Cu-Na-MOR decay upon reaction of calcined Cu-Na-MOR with methane,5b however its appearance was inconsistent in Cu-MOR of different Si/Al and Cu/Al ratios.5c For this band to be a d–d transition of the square pyramidal or planar Cu2+ species absorbing at 13 300 cm−1 or 16 700 cm−1, two observations must be true. First, the 9600 cm−1 band should decay after thermal treatment in Ar for any Cu-MOR sample regardless of Brønsted acidity since all Cu-MOR samples contain both square pyramidal and planar species. Second, the intensity of the d–d transitions should correlate to the 9600 cm−1 band. However, as shown in Figure 4, the 9600 cm−1 band appeared prominently only in Cu-H-MOR and was either absent in carbonylation inactive Cu-Na-MOR (Cu/Al = 0.36, Figure 4C, Figure 2) or was a small shoulder in Cu-Na-MOR with trace Brønsted acidity (Figure 4A, Figure 1). Thus, the 9600 cm−1 band appeared to form exclusively within Cu-MOR samples that were active for carbonylation after methane oxidation. Additionally, the 13 600 cm−1 and 16 700 cm−1 bands gained intensity after thermal treatment in Ar, but the 9600 cm−1 band lost intensity (Figure 4A). Yet, the inverse trend was observed upon calcination of Cu-H-MOR, showing that the 9600 cm−1 band could not represent the same Cu2+ species as the other d–d transitions. Thus, we can exclude the possibility of the 9600 cm−1 band being an electronic transition of the 13 300 and 16 700 cm−1 d–d transitions and is likely associated with a unique Cu center. While the 9600 cm−1 band was present in carbonylation active Cu-Na-MOR (Cu/Al = 0.22 and Na/Al = 0.63), the surface methoxy groups formed were still highly localized onto copper sites (Table S3). We note that the percentage of CH3 18OH extracted from Cu-Na-MOR samples with carbonylation inactive Cu/Al = 0.36 and carbonylation active Cu/Al = 0.22 ratios was identical. Additionally, 13C[1H] CP MAS NMR spectra showed no methoxy species on Brønsted acid sites in Cu-Na-MOR (Cu/Al = 0.36). These data suggest that the copper species represented by the 9600 cm−1 band in Cu-H-MOR and Cu-Na-MOR (Cu/Al = 0.22) is both oxidation and carbonylation active and it is much more readily formed in the presence of Brønsted acidity.
The copper concentration range at which the 9600 cm−1 band forms differs drastically from that required to form the mono-(μ-oxo) dicupric species. As previously reported for Cu-Na-ZSM-5 and Cu-Na-MOR, the transition at 22 700 cm−1 and 30 000 cm−1 associated with the mono-(μ-oxo) dicupric site is only observed for samples with Cu/Al > 0.20.5b-d,7c,8,12,21a,22 In Cu-Na-MOR, the mono-(μ-oxo) dicupric species formed when the square planar Cu2+ species was exchanged into the zeolite.5c,8,21a Isolated square pyramidal Cu2+ species present at low copper contents was inactive for methane oxidation, proved difficult to reduce, and was shown not to form the mono-(μ-oxo) dicupric site.21a In Cu-H-MOR samples with low Cu/Al ratios (ranging from 0.17 to 0.10), the 9600 cm−1 band also decays after reaction with methane (Figure S9, A and B). At Cu/Al = 0.10, traces of the d–d transition at 16 700 cm−1 were present, so it is possible that square planar or pyramidal Cu2+ could be the precursors to the methane oxidation active site. Interestingly, the yields of acetic acid and methanol from Cu-H-MOR at Cu/Al = 0.17 were 22.6 and 26.0 μmol/gcat (Figure 5), respectively, which are values virtually identical to those observed for Cu-H-MOR with a Cu/Al = 0.20. For samples with Cu/Al ratios of 0.25, the methanol extracted from the zeolite increased to 35.5 μmol/gcat. At this Cu/Al ratio, the mono-(μ-oxo) dicupric site should form within Cu-MOR, implying that the mono-(μ-oxo) dicupric site is solely responsible for the formation of the additional methanol and is not associated with the formation of acetic acid. This observation is consistent with the lack of carbonylation activity within Cu-Na-ZSM-5 (Figure 2).
The reactivity and characterization data suggest the presence of two coexisting pathways: methane oxidation/carbonylation at a copper center and methane oxidation followed by migration of methoxy species to a carbonylation-active Brønsted acid site. The exact mechanism responsible for the migration of methoxy species from the copper site is unknown and requires further investigation. Previous methane oxidation studies over Cu-Na-ZSM-5 and Cu-Na-MOR reported that methanol was not evolved after flowing methane over the activated zeolite.5b Along with DFT studies,7c the product after methane oxidation was a methoxy species bound to the mono-(μ-oxo) dicupric site. This was consistent with mechanisms of stoichiometric methane or benzene oxidation over Fe-ZSM-5 resulting in (FeIII– OCH3)α 19,23 or (FeIII–OPh)α groups.24 Recently, Panov and co-workers25 proposed a quasicatalytic reaction mechanism over Fe–H-ZSM-5 involving the surface diffusion of molecular methanol from the FeIII–Oα active sites to the Brønsted acid sites. Desorption of methanol into the gas phase was not favorable under temperatures of 523 K; however, surface diffusion had a lower activation energy that allowed methanol to migrate within the zeolite at temperatures as low as 333 K. Unfortunately, no explanation was provided as to how molecular methanol was generated from surface methoxy species under water-free reaction conditions. To gain insight into the nature of the sites involved in the potential production of methanol from methoxy species, we performed X-band continuous-wave electron paramagnetic resonance (EPR) spectroscopy on Cu-H-MOR and two Cu-Na-MOR samples that were dried under Ar or calcined. The full-length spectra are shown in Figure S13. As the values of gzz and Azz are the most informative for identification of Cu2+ sites we show the low-field region of the spectra in detail in Figure 6. The spectra of the two Cu-Na-MOR samples (Cu/Al = 0.36, Na/Al = 0.37 vs Cu/Al = 0.22, Na/Al = 0.63), dried under Ar, are similar. Both spectra show features due to at least two species: one species with gzz = 2.33 and Azz = 163 × 10−4 cm−1 (referred to as site 2 hereafter, see Table 1) and a second species to which we tentatively assign gzz = 2.27 and Azz = 183 × 10−4 cm−1 following Vandelderen et al.21a and Delabie et al.21b (called site 3 hereafter). In the spectrum of Cu/Al = 0.22 (blue) the features of site 2 are more prominent than in the spectrum of Cu/Al = 0.36 (black) and in addition this spectrum shows an unidentified signal at 272.6 mT marked with an astrisk,*. The spectrum of Cu-H-MOR (Cu/Al = 0.20, Na/Al = 0.03), dried under Ar, clearly shows the features of site 2, and also a small fraction of species 3 appears to be present. In addition the spectrum shows a third species (called site 1) with gzz = 2.37 and Azz = 149 × 10−4 cm−1. Upon calcination, the total signal of Cu2+ species reduces for all three zeolites. This was consistent with the reduction of the 13 300 cm−1 and 16 700 cm−1 signals for square pyramidal and planar Cu2+ species in Cu-H-MOR (Figure 4A) and the 13 600 cm−1 and 16 750 cm−1 signals in Cu-Na-MOR (Figure 4B–C). This signal loss in Figure 6 was attributed to the formation of EPR silent copper species, which occurs in significant quantities above Cu/Al of 0.20.5a,22 Multiple EPR silent species could be responsible for methane oxidation activity in Cu-H-MOR (Cu/Al = 0.20) and Cu-Na-MOR (Cu/Al = 0.22), so the lack of the 22 200 cm−1 band for the Cu–O–Cu site in their UV–vis spectra (Figure 4A-B) may suggest alternate copper active sites at low Cu/Al. After calcination, the relative contribution of species 1 to the spectrum of Cu-H-MOR increases. Species 2 is still clearly present, but the presence of species 3 cannot be established with certainty. A similar effect is seen in the spectra of the two calcined Cu-Na-MOR samples: the presence of species 2 is obvious, whereas the fraction of species 3 has become very small. Other authors have observed species in Cu-MOR with parameters similar to species 2 and 3. They are generally associated with a square pyramidal and a square planar Cu2+ site, respectively.7a,21,26 Sites with high g-values of 2.37– 2.40 have been observed in Cu-MOR27 and other zeolites that were not thermally treated, in which case they were always associated with hydrated Cu2+.28 For instance, electron spin echo envelope modulation (ESEEM) spectroscopy attributed a gzz = 2.38 signal to a Cu2+ species coordinated to three water molecules when the sample was evacuated at 323 K.29 In addition, a hydrated Cu2+ site has been observed by X-ray diffraction in Cu-MOR that was heated up to 783 K.30 Moreover, the 12 500 cm−1 band we observe in calcined Cu-H-MOR (Figure 4A) has been observed in untreated Cu-MOR and was associated with hydrated Cu2+.21a It is tempting to speculate on how a hydrated Cu species could be involved in the reaction pathway. The presence of water molecules in close proximity to the copper species would allow for surface methoxy species to become hydrolyzed into molecular methanol, ultimately enabling a reaction pathway involving surface methanol diffusion, methoxy formation and subsequent carbonylation over the Brønsted acid sites. While our data confirm the presence of site 1, which has also been observed in Cu-H-MOR evacuated at 673 K,29 it is unclear if site 1 corresponds to a hydrated species. The experiments were performed under strict anhydrous conditions and it seems unlikely that that dehydration was incomplete for our samples. Indeed, near-infrared (NIR) spectra on heat-treated Cu-MOR do not show simultaneous bands around 5200 and ca. 7000 cm−1 corresponding to water molecules in the sample (Figure S10). Evidently, more detailed investigations are needed to understand the nature of the environment surrounding site 1.
Figure 6.
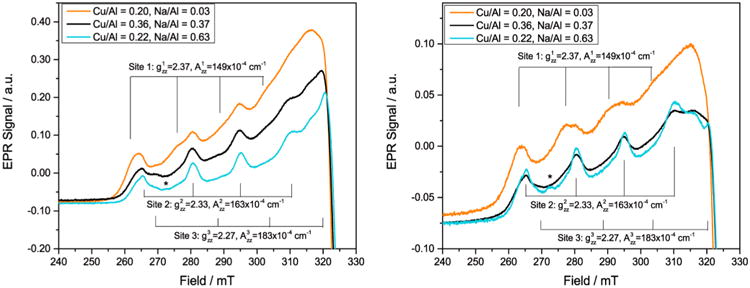
EPR spectra (9.40 GHz) of (orange) Cu-H-MOR (Cu/Al = 0.20, Na/Al = 0.03), (black) Cu-Na-MOR (Cu/Al = 0.36, Na/Al = 0.37), and (cyan) Cu-Na-MOR (Cu/Al = 0.22, Na/Al = 0.63). (Left) Cu-MOR thermally treated under Ar for 3 h at 823 K and (Right) Cu-MOR calcined under O2 for 5 h at 823 K and purged under Ar before acquisition.
Table 1. EPR Parameters for Cu2+ Species in Cu-MOR Treated Under Argon and Oxygen.
| Cu2+ site | gzz | Azz (× 10−4 cm−1) | gxx =gyy | Axx (× 10−4 cm−1) | d–d trans. (cm−1) | geometry |
|---|---|---|---|---|---|---|
| 1 | 2.37 | 149 | – | – | 12 500 | |
| 2 | 2.33 | 163 | 2.06 | 18.2 | 13 600 | sq.pyramidal |
| 3 | 2.27 | 183 | 2.09 | 42.8 | 16 750 | sq.planar |
Conclusions
Methane can be converted into acetic acid over copper exchanged mordenite zeolites. Reactivity and spectroscopic measurements on Cu-MOR with varying concentrations of Brønsted acid sites revealed notable differences in the types of Cu2+ species and product distributions from the tandem oxidation/carbonylation sequences. In Cu-Na-MOR without Brønsted acid sites, EPR and d–d transitions characteristic of square pyramidal and planar species were present, along with the characteristic 22 200 cm−1 band for the methane oxidation active site previously identified for Cu-ZSM-5. Accordingly, these materials showed methane oxidation activity but were carbonylation inactive above Cu/Al = 0.30. In contrast, Cu-MOR samples containing Brønsted acid sites were drastically more carbonylation active, even at Cu/Al ratios <0.2. In these samples, spectroscopic data shows the presence of a new Cu2+ site. After reaction with methane, a unique band at 9600 cm−1 decayed, suggesting the presence of a different methane oxidation active site. The coupled methane oxidation and carbonylation reactions showed that when trace amounts of Brønsted acid sites were present, carbonylation activity was enhanced. Methane oxidation over Cu-H-MOR has important consequences, since it generates methoxy species that are located on the Brønsted acid sites of the zeolite that can serve as intermediates in many other types of reactions to create industrially relevant products.31 The detailed characterization of the copper active sites and the migration of the methoxy species is the focus of our current investigations.
Supplementary Material
Acknowledgments
This work was supported by the Massachusetts Institute of Technology Energy Initiative's Seed Fund. The NMR used for quantification at the Department of Chemistry's Instrumentation Facility was supported by the NSF (Award Nos. CHE-9808061 and DBI-9729592). We acknowledge the National Institutes of Health for funding support of NMR and EPR at the Francis Bitter Magnet Laboratory (EB-002026). V.K.M. is grateful to the Natural Sciences and Engineering Research Council of Canada and Government of Canada for a Banting Postdoctoral Fellowship. G.M. gratefully acknowledges the Netherlands Organization for Scientific Research (NWO) for a Rubicon Fellowship. Y.R-L. thanks the MIT-Japan Hayashi Seed Grant Project for travel funds.
Footnotes
Supporting Information: Experimental details, 13C[1H] CP-MAS NMR spectra of surface species on Cu-MOR, UV–visible–NIR spectroscopy of Cu-MOR at low Cu/Al, control experiments with 18O2, dimethyl ether carbonylation, full X-band EPR spectra. This material is available free of charge via the Internet at http://pubs.acs.org.
Notes: The authors declare no competing financial interest.
References
- 1.(a) Hammond C, Conrad S, Hermans I. ChemSusChem. 2012;5:1668. doi: 10.1002/cssc.201200299. [DOI] [PubMed] [Google Scholar]; (b) Lunsford JH. Catal Today. 2000;63:165. [Google Scholar]
- 2.(a) Shu L, Nesheim JC, Kauffmann K, Munck E, Lipscomb JD, Que L. Science. 1997;275:515. doi: 10.1126/science.275.5299.515. [DOI] [PubMed] [Google Scholar]; (b) Lee D, Lippard SJ. J Am Chem Soc. 1998;120:12153. [Google Scholar]; (c) Lee SK, Fox BG, Froland WA, Lipscomb JD, Munck E. J Am Chem Soc. 1993;115:6450. [Google Scholar]; (d) Kopp DA, Lippard S. J Curr Opin Chem Biol. 2002;6:568. doi: 10.1016/s1367-5931(02)00366-6. [DOI] [PubMed] [Google Scholar]
- 3.(a) Lieberman RL, Rosenzweig AC. Nature. 2005;434:177. doi: 10.1038/nature03311. [DOI] [PubMed] [Google Scholar]; (b) Balasubramanian R, Smith SM, Rawat S, Yatsunyk LA, Stemmler TL, Rosenzweig AC. Nature. 2010;465:115. doi: 10.1038/nature08992. [DOI] [PMC free article] [PubMed] [Google Scholar]
- 4.(a) Panov G, Sheveleva G, Kharitonov Aea, Romannikov V, Vostrikova L. Appl Catal, A. 1992;82:31. [Google Scholar]; (b) Ovanesyan N, Shteinman A, Dubkov K, Sobolev V, Panov G. Kinet Catal. 1998;39:792. [Google Scholar]
- 5.(a) Vanelderen P, Hadt RG, Smeets PJ, Solomon EI, Schoonheydt RA, Sels BF. J Catal. 2011;284:157. doi: 10.1016/j.jcat.2011.10.009. [DOI] [PMC free article] [PubMed] [Google Scholar]; (b) Groothaert MH, Smeets PJ, Sels BF, Jacobs PA, Schoonheydt RA. J Am Chem Soc. 2005;127:1394. doi: 10.1021/ja047158u. [DOI] [PubMed] [Google Scholar]; (c) Smeets PJ, Groothaert MH, Schoonheydt RA. Catal Today. 2005;110:303. [Google Scholar]; (d) Beznis NV, Weckhuysen BM, Bitter JH. Catal Lett. 2010;138:14. [Google Scholar]
- 6.(a) Zecchina A, Rivallan M, Berlier G, Lamberti C, Ricchiardi G. Phys Chem Chem Phys. 2007;9:3483. doi: 10.1039/b703445h. [DOI] [PubMed] [Google Scholar]; (b) Berlier G, Spoto G, Fisicaro P, Bordiga S, Zecchina A, Giamello E, Lamberti C. Microchem J. 2002;71:101. [Google Scholar]; (c) Buda F, Ensing B, Gribnau MCM, Baerends E. J Chem—Eur J. 2003;9:3436. doi: 10.1002/chem.200204444. [DOI] [PubMed] [Google Scholar]; (d) Hammond C, Forde MM, Ab Rahim MH, Thetford A, He Q, Jenkins RL, Dimitratos N, Lopez-Sanchez JA, Dummer NF, Murphy DM, Carley AF, Taylor SH, Willock DJ, Stangland EE, Kang J, Hagen H, Kiely CJ, Hutchings G. J Angew Chem, Int Ed. 2012;51:5129. doi: 10.1002/anie.201108706. [DOI] [PubMed] [Google Scholar]
- 7.(a) Vanelderen P, Vancauwenbergh J, Sels BF, Schoonheydt RA. Coord Chem Rev. 2013;257:483. [Google Scholar]; (b) Tsai ML, Hadt RG, Vanelderen P, Sels BF, Schoonheydt RA, Solomon EI. J Am Chem Soc. 2014;136:3522. doi: 10.1021/ja4113808. [DOI] [PubMed] [Google Scholar]; (c) Woertink JS, Smeets PJ, Groothaert MH, Vance MA, Sels BF, Schoonheydt RA, Solomon EI. Proc Natl Acad Sci U S A. 2009;106:18908. doi: 10.1073/pnas.0910461106. [DOI] [PMC free article] [PubMed] [Google Scholar]
- 8.Alayon EM, Nachtegaal M, Ranocchiari M, van Bokhoven JA. Chem Commun. 2012;48:404. doi: 10.1039/c1cc15840f. [DOI] [PubMed] [Google Scholar]
- 9.(a) Bhan A, Allian AD, Sunley GJ, Law DJ, Iglesia E. J Am Chem Soc. 2007;129:4919. doi: 10.1021/ja070094d. [DOI] [PubMed] [Google Scholar]; (b) Boronat M, Martínez-Sanchez C, Law D, Corma A. J Am Chem Soc. 2008;130:16316. doi: 10.1021/ja805607m. [DOI] [PubMed] [Google Scholar]; (c) Boronat M, Martínez C, Corma A. Phys Chem Chem Phys. 2011;13:2603. doi: 10.1039/c0cp01996h. [DOI] [PubMed] [Google Scholar]; (d) Li B, Xu J, Han B, Wang X, Qi G, Zhang Z, Wang C, Deng F. J Phys Chem C. 2013;117:5840. [Google Scholar]; (e) Bhan A, Iglesia E. Acc Chem Res. 2008;41:559. doi: 10.1021/ar700181t. [DOI] [PubMed] [Google Scholar]
- 10.Roman-Leshkov Y, Moliner M, Davis ME. J Phys Chem C. 2010;115:1096. [Google Scholar]
- 11.Blasco T, Boronat M, Concepcion P, Corma A, Law D, Vidal-Moya JA. Angew Chem. 2007;119:4012. doi: 10.1002/anie.200700029. [DOI] [PubMed] [Google Scholar]
- 12.Smeets PJ, Hadt RG, Woertink JS, Vanelderen P, Schoonheydt RA, Sels BF, Solomon EI. J Am Chem Soc. 2010;132:14736. doi: 10.1021/ja106283u. [DOI] [PMC free article] [PubMed] [Google Scholar]
- 13.Alayon EMC, Nachtegaal M, Kleymenov E, van Bokhoven JA. Microporous Mesoporous Mater. 2013;166:131. [Google Scholar]
- 14.(a) Cheung P, Bhan A, Sunley GJ, Iglesia E. Angew Chem, Int Ed. 2006;45:1617. doi: 10.1002/anie.200503898. [DOI] [PubMed] [Google Scholar]; (b) Cheung P, Bhan A, Sunley GJ, Law DJ, Iglesia E. J Catal. 2007;245:110. [Google Scholar]
- 15.(a) Drake IJ, Fujdala KL, Bell AT, Tilley TD. J Catal. 2005;230:14. [Google Scholar]; (b) Zhang Y, Drake IJ, Briggs DN, Bell AT. J Catal. 2006;244:219. [Google Scholar]; (c) Zheng X, Bell AT. J Phys Chem C. 2008;112:5043. [Google Scholar]; (d) Zhang Y, Briggs DN, de Smit E, Bell AT. J Catal. 2007;251:443. [Google Scholar]; (e) King ST. J Catal. 1996;161:530. [Google Scholar]; (f) Zhang Y, Bell AT. J Catal. 2008;255:153. [Google Scholar]
- 16.(a) Parrillo DJ, Adamo AT, Kokotailo GT, Gorte R. J Appl Catal. 1990;67:107. [Google Scholar]; (b) Farneth WE, Gorte R. J Chem Rev. 1995;95:615. [Google Scholar]; (c) Parrillo DJ, Dolenec D, Gorte RJ, McCabe RW. J Catal. 1993;142:708. [Google Scholar]
- 17.Larsen SC, Aylor A, Bell AT, Reimer JA. J Phys Chem. 1994;98:11533. [Google Scholar]
- 18.Li Y, Hall WK. J Catal. 1991;129:202. [Google Scholar]
- 19.Starokon EV, Parfenov MV, Pirutko LV, Abornev SI, Panov GI. J Phys Chem C. 2011;115:2155. [Google Scholar]
- 20.(a) Panov G, Sobolev V, Dubkov K, Parmon V, Ovanesyan N, Shilov A, Shteinman A. React Kinet Catal Lett. 1997;61:251. [Google Scholar]; (b) Wang W, Seiler M, Hunger M. J Phys Chem B. 2001;105:12553. [Google Scholar]; (c) Forester T, Howe R. J Am Chem Soc. 1987;109:5076. [Google Scholar]; (d) Anderson MW, Klinowski J. J Am Chem Soc. 1990;112:10. [Google Scholar]; (e) Blaszkowski S, Van Santen R. J Phys Chem. 1995;99:11728. [Google Scholar]
- 21.(a) Vanelderen P, Vancauwenbergh J, Tsai ML, Hadt RG, Solomon EI, Schoonheydt RA, Sels BF. ChemPhysChem. 2014;15:91. doi: 10.1002/cphc.201300730. [DOI] [PubMed] [Google Scholar]; (b) Delabie A, Pierloot K, Groothaert MH, Weckhuysen BM, Schoonheydt RA. Phys Chem Chem Phys. 2002;4:134. [Google Scholar]
- 22.Groothaert MH, Pierloot K, Delabie A, Schoonheydt RA. Phys Chem Chem Phys. 2003;5:2135. [Google Scholar]
- 23.Starokon EV, Parfenov MV, Arzumanov SS, Pirutko LV, Stepanov AG, Panov GI. J Catal. 2013;300:47. [Google Scholar]
- 24.(a) Yoshizawa K, Shiota Y, Kamachi T. J Phys Chem B. 2003;107:11404. [Google Scholar]; (b) Fellah MF, Pidko EA, van Santen RA, Onal I. J Phys Chem C. 2011;115:9668. [Google Scholar]
- 25.Parfenov MV, Starokon EV, Pirutko LV, Panov GI. J Catal. 2014;318:14. [Google Scholar]
- 26.(a) Tavernier SD, Schoonheydt RA. Zeolites. 1991;11:155. [Google Scholar]; (b) Dedecek J, Sobalik Z, Tvaruazkova Z, Kaucky D, Wichterlova B. J Phys Chem. 1995;99:16327. [Google Scholar]
- 27.Carl PJ, Larsen SC. J Phys Chem B. 2000;104:6568. [Google Scholar]
- 28.(a) Nicula A, Stamires D, Turkevich J. J Chem Phys. 1965;42:3684. [Google Scholar]; (b) Kucherov A, Slinkin A, Kondrat'ev D, Bondarenko T, Rubinstein A, Minachev KM. Zeolites. 1985;5:320. [Google Scholar]; (c) Anderson MW, Kevan L. J Phys Chem. 1987;91:4174. [Google Scholar]
- 29.Sass CE, Kevan L. J Phys Chem. 1989;93:4669. [Google Scholar]
- 30.Attfield MP, Weigel SJ, Cheetham AK. J Catal. 1997;170:227. [Google Scholar]
- 31.Wang W, Hunger M. Acc Chem Res. 2008;41:895. doi: 10.1021/ar700210f. [DOI] [PubMed] [Google Scholar]
Associated Data
This section collects any data citations, data availability statements, or supplementary materials included in this article.


