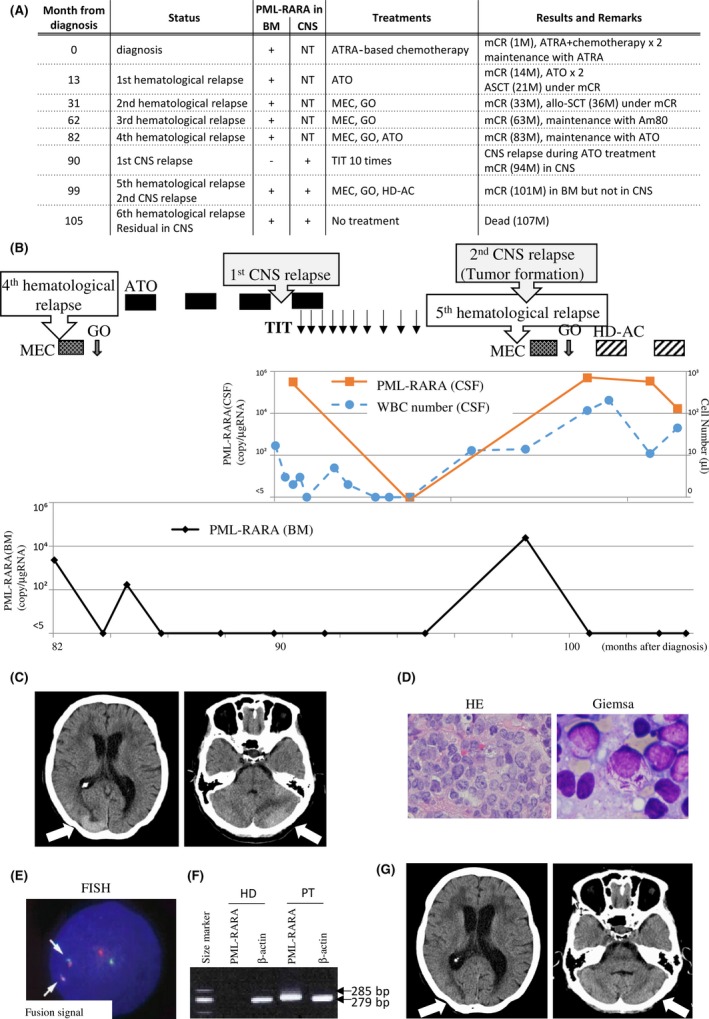
Figure 1.

Case 1 presentation. (A) Entire clinical course. CNS, central nervous system; BM, bone marrow; TIT, triple intrathecal therapy; mCR, molecular complete remission; ATRA, all‐trans retinoic acid; ASCT, autologous stem cell transplantation; allo‐SCT, allogeneic stem cell transplantation; NT, not tested. (B) Clinical course of case 1 after fourth relapse that occur at 98 months or 62 months after initial diagnosis or allo‐SCT, respectively. The provided treatments are shown in the upper. Graphs show PML‐RARA copy number in the BM or CSF, and WBC number in the CSF as indicated. (C) Head CT analysis when bleariness occurred. Tumor formation was observed in the left hemisphere of cerebellum and the right occipital lobe cortex. Both lesions are indicated by arrows. (D) Morphologic analyses of the biopsy sample from the CNS tumor by hematoxylin and eosin staining (HE, left, 400 × ) and Giemsa staining (right, 1000×). (E) Fluorescence in situ hybridization (FISH) analysis of the WBC cells from the CSF. 98% cells were fusion signal positive in the CNS tumor biopsy sample. The PML probe and the RARA probe are labeled with red and green, respectively. Arrows indicate fusion signals. (F) Reverse transcription polymerase chain reaction (RT‐PCR) of PML‐RARA. The 285‐bp band indicates the bcr3 type of the PML‐RARA fusion gene. The 279‐bp band indicates an internal control. HD and PT mean a healthy donor and the patient, respectively. (G) Head CT analysis before the treatment with HD‐AC. Tumors indicated by arrows were reduced by MEC and GO.
