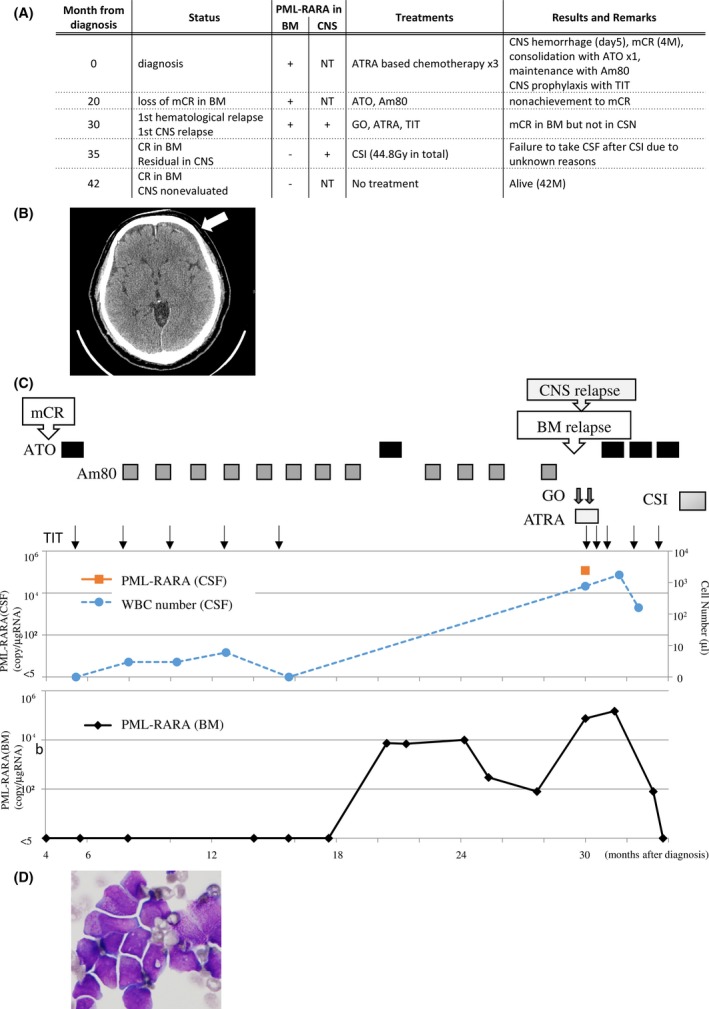
Figure 3.

Case 3 presentation. (A) Entire clinical course. Abbreviations are as shown in Figure 1A. (B) Head CT analysis revealed subdural hematoma (indicated by arrow) during induction therapy. (C) Clinical course of case 3 after mCR that achieved at 4 months after initial diagnosis. The provided treatments are shown in the upper panel. Graphs show PML‐RARA copy number in the BM or CSF, and WBC number in the CSF as indicated. (D) Morphologic analyses of the WBC cells from the CSF by Giemsa staining (1000×).
