
Figure 1. Characterization of Mtcl1 gene‐trap mice.
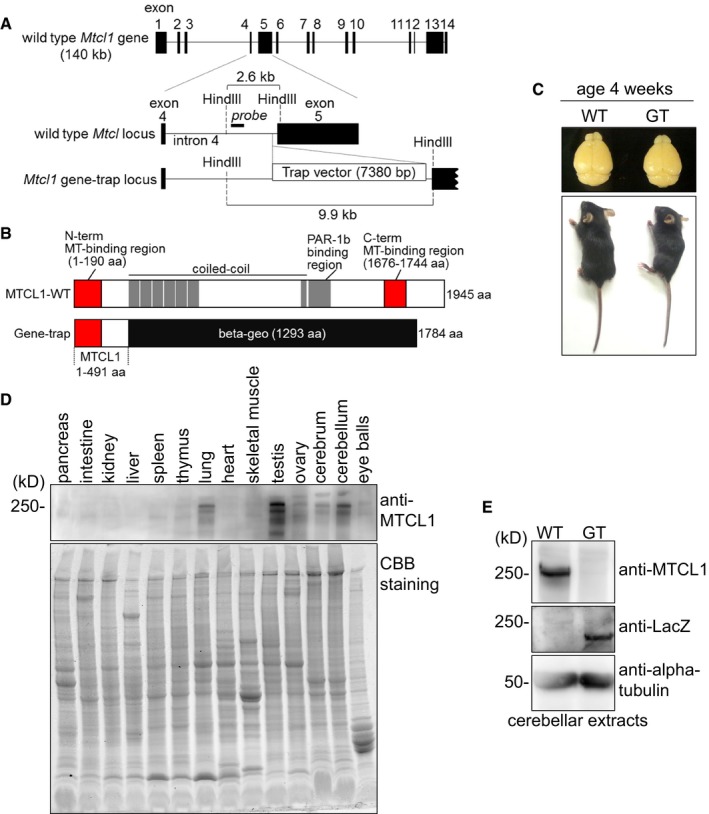
- Schematic of the Mtcl1 allele in mouse. In GT mice, the beta‐geo‐based gene‐trap vector was inserted into intron 4. Black blocks represent exons. For Southern blotting, genomic DNA was digested with HindIII and hybridized with the probe depicted (see also Appendix Fig S1).
- Schematic of MTCL1 WT and mutant proteins.
- Representative pair of WT and GT littermates at 4 weeks of age (lower), with dorsal views of their brains (upper).
- Western blot analysis of various tissue lysates from WT mice at 4 weeks of age using anti‐MTCL1 antibodies (upper). The replica gel was stained with Coomassie brilliant blue to verify protein loading (lower).
- Western blot analysis of cerebellar lysates from WT and GT littermates at 7 weeks of age using anti‐MTCL1, anti‐beta‐galactosidase (LacZ), and anti‐alpha‐tubulin antibodies.