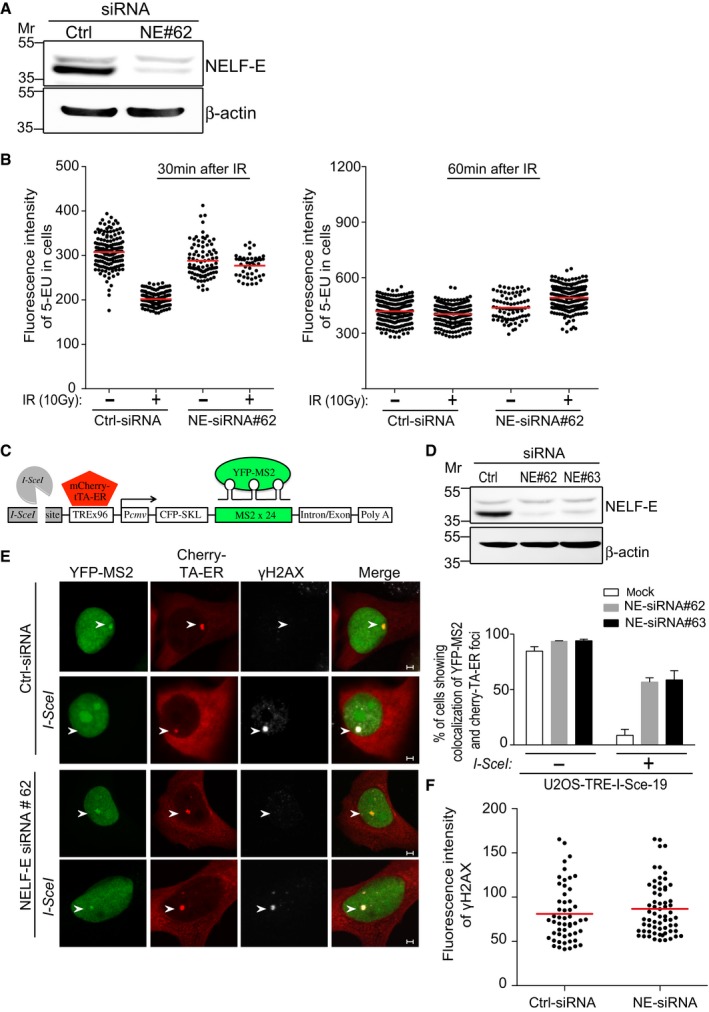
Western blot shows knockdown of NELF‐E in U2OS cells. Cells were transfected with control siRNA (Ctrl) or NELF‐E siRNA#62 and 72 h post‐transfection cells were lysed and subjected to Western blot using NELF‐E antibody. β‐actin was used as a loading control.
NELF‐E promotes global transcriptional silencing after ionizing radiation. Control and NELF‐E siRNA‐treated U2OS cells were exposed to IR (10 Gy) followed by 20‐min incubation with 5‐ethynyl uridine (5‐EU). Cells were then fixed at the indicated time points, and 5‐EU incorporation into newly synthesized RNA was detected using Alexa Fluor 594. The data are representative of two independent experiments. Red horizontal bars indicate the mean fluorescence intensity of 5‐EU in cells.
Schematic of the reporter cassette integrated into the genome of U2OS‐TRE‐I‐Sce‐19 cells. It includes an I‐SceI recognition site, 96 copies of tetracycline response element (TRE), a CMV minimal promoter, CFP fused to a peroxisomal targeting signal (SKL), and 24 repeats of the MS2 RNA stem loop sequence.
Knockdown of NELF‐E in U2OS‐TRE‐I‐Sce‐19 cells. Cells were transfected with control siRNA (Ctrl) or two different NELF‐E siRNA sequences and subjected to Western blot analysis. β‐actin was used as a loading control.
NELF‐E is required for DSB‐induced transcriptional silencing. Mock and NELF‐E‐depleted U2OS‐TRE‐I‐Sce‐19 cells were transfected with pCherry‐tTA‐ER and pYFP‐MS2 plasmids and treated with 1 μM tamoxifen for 2 h to activate transcription of the MS2 gene. To induce DSB upstream of the MS2 gene, cells were transfected with a third plasmid expressing I‐SceI endonuclease. Cells were fixed and immunostained with γH2AX. Representative images were acquired using confocal microscope. Graph displays the percentage of cells that show colocalization of YFP‐MS2 and Cherry‐tTA‐ER. Data are represented as mean ± standard deviation (SD) from at least three independent experiments. The transcription of the MS2 gene is marked with white arrowheads. Scale bar, 2 μm.
Quantitative measurements show that NELF‐E depletion has no detectable effect on the fluorescence intensity of γH2AX foci at DSB sites. Red horizontal bars indicate the mean fluorescence intensity of γH2AX in cells.