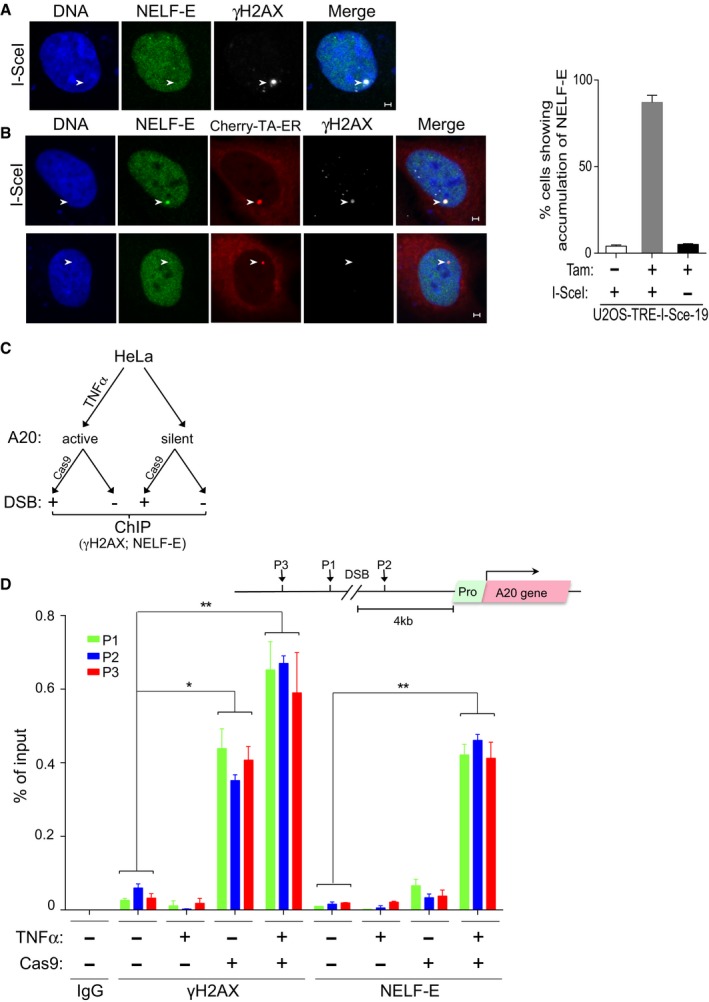
Representative cell showing that NELF‐E is not recruited to I‐SceI‐induced DSBs upstream of transcriptionally inactive MS2 gene. U2OS‐TRE‐I‐Sce‐19 cells were transfected with pCMV‐NLS‐I‐SceI plasmid to induce DSB upstream of the silent MS2 gene. 24 h post‐transfection cells were fixed and co‐stained for NELF‐E (green) and γH2AX (gray). DNA is stained with DAPI (blue). White arrowheads mark the location of the MS2 reporter cassette. Scale bar, 2 μm.
As in (A), except that U2OS‐TRE‐I‐Sce‐19 cells were co‐transfected with pCherry‐tTA‐ER and treated with Tam to induce MS2 expression. Top panel shows that NELF‐E is recruited to I‐SceI‐induced DSBs upstream of transcriptionally active gene. Bottom panel shows no accumulation of NELF‐E at transcriptionally active MS2 gene in the absence of DSBs. Scale bar, 2 μm. Graph on the right displays the percentage of cells that show colocalization of NELF‐E and γH2AX. White arrowheads mark the location of the MS2 reporter cassette. Data are represented as mean ± SD from three independent experiments.
A diagram showing the layout of a ChIP experiment that aims to test the accumulation of NELF‐E at DSBs induced by CRISPR‐Cas9 upstream of transcriptionally active or inactive A20 gene.
Endogenous NELF‐E is preferentially recruited to DSBs induced upstream of active rather than inactive A20 gene. A schematic diagram depicting the position of the DSB induced by Cas9, A20 gene, and its promoter, and the position of three DNA sequences (P1, P2, and P3) that were tested by real‐time PCR for the presence of NELF‐E and γH2AX (top). Graph represents the results of ChIP analysis showing the binding of endogenous NELF‐E and the abundance of γH2AX at three positions near DSBs upstream of transcriptionally active (HeLa cells treated with TNFα) and inactive (untreated cells) A20 gene. The occupancy of NELF‐E and γH2AX at P1, P2, and P3 sites was determined by quantitative real‐time PCR analysis and normalized to input. Error bars represent SD from three independent experiments. Asterisks depict statistically significant differences in the values of P1, P2, and P3 when compared to the corresponding values of the control samples that were not treated with TNFα and Cas9. Statistical analysis was performed by Student's t‐test, *P < 0.05, **P < 0.01.