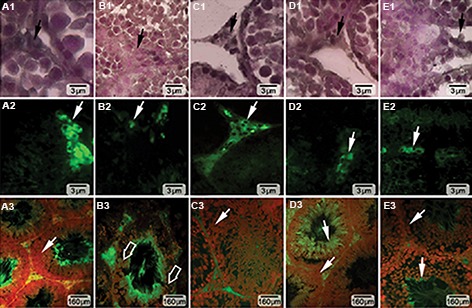
Fig.4.

Cross section from seminiferous tubules of A. Control, B. ATZ, C. ATZ+VitE, D. ATZ+T, and E. ATZ+VitE+T groups. First and second rows show intra-cytoplasmic steroid (unsaturated fatty acid) foci in Leydig cells (arrows), which are marked in A1, B1, C1, D1, E1. Black using Sudan Black B, A2, B2, C2, D2, E2. Special flourescent stainig techniques. Alone- and Co-administration of VitE and T enhanced steroidogenesis in Leydig cells, and A3, B3, C3, D3, E3. Represent mRNA damage at germinal cells level. Severe mRNA damage is shown with thick arrows in ATZ-induced group, but it is ameliorated (thin arrows) in ATZ+VitE and ATZ+T groups. ATZ; Atrazine, VitE; Vitamin E, and T; Testosterone.
