
Figure EV1. Effect of niacin on PG, RvE1, and LXA4 production in mice after DSS challenge.
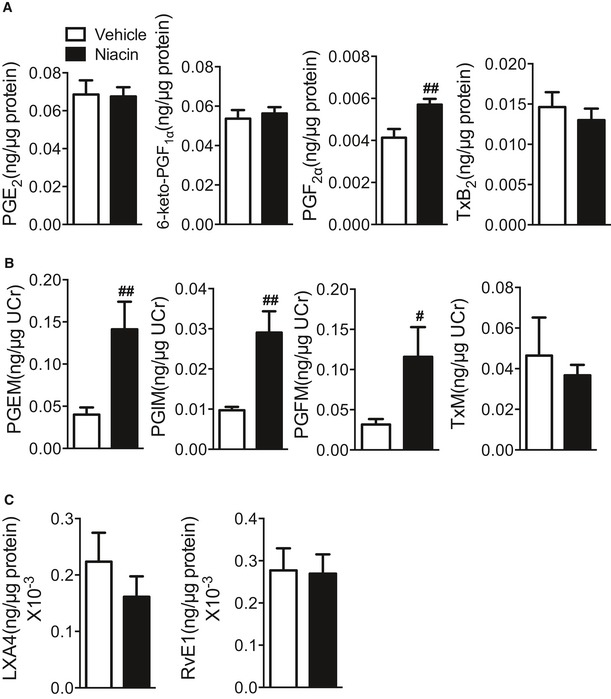
- Mass spectrometry analysis of PG production in colons from niacin (600 mg/kg)‐treated mice after DSS challenge. Vehicle, n = 6; niacin 600 mg/kg, n = 7.
- Measurement of urinary metabolite of PGs in niacin (600 mg/kg)‐treated mice. PGEM, 11α‐hydroxy‐9,15‐dioxo‐2,3,4,5‐tetranor‐prostane‐1,20‐dioic acid; PGIM, 2,3‐dinor‐6‐keto‐PGF1α; TxM, 2,3‐dinor‐TxB2; PGFM, 13,14‐dihydro‐15‐keto‐PGF2α. n = 6.
- Mass spectrometry analysis of RvE1 and LXA4 production in colons from niacin (600 mg/kg)‐treated mice after DSS challenge. n = 6.