-
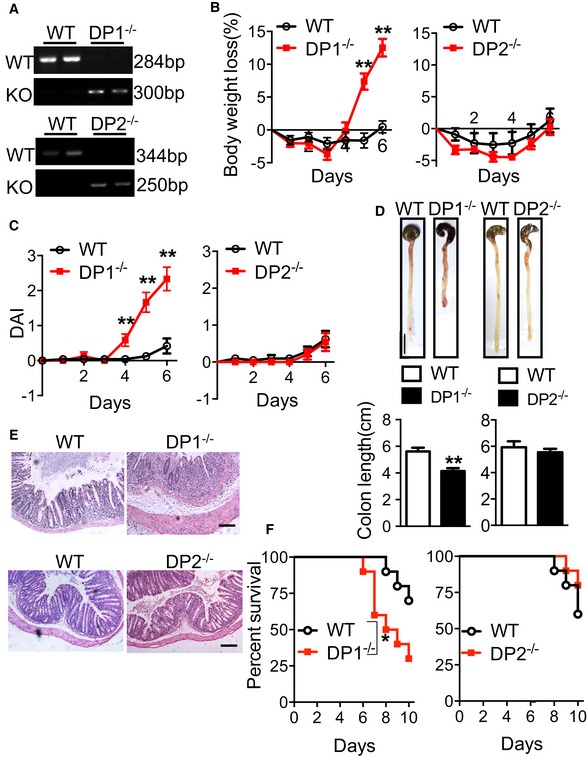
A
PCR analysis of tail genomic DNA from DP1−/−, DP2−/−, and WT mice.
-
B–D
Body weight loss (B) and disease activity index (C), and colon length (D) of DP1−/−, DP2−/−, and WT mice in response to DSS challenge. Scale bar: 1 cm.
-
E
H&E staining of histological sections in the distal colon from the mice administered with DSS for 6 days. Scale bars: 100 μm. Graphs represent overall histology score.
-
F
Survival rates of DSS‐challenged DP1−/−, DP2−/− mice, and WT controls.
Data information: Data are shown as mean ± SEM. Data are representative of three independent experiments. (B–D) Statistical significance was determined using unpaired Student's
t‐tests. **
P < 0.01 compared with WT. Left panel: WT,
n = 8; DP1
−/−,
n = 8. Right panel: WT,
n = 7; DP2
−/−,
n = 8. (F) Survival rate was compared using the log‐rank test. *
P < 0.05, compared with WT;
n = 10.