-
A–C
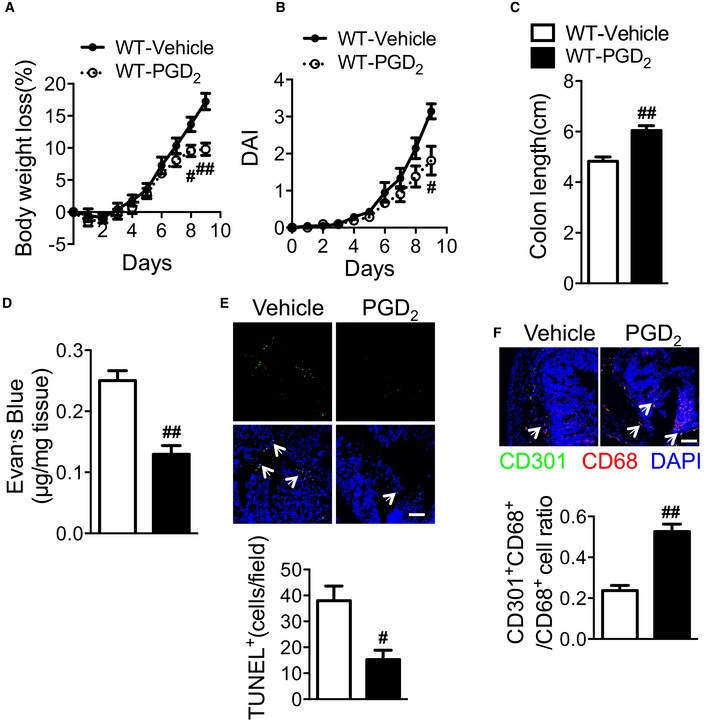
Effect of PGD2 treatment on body weight loss (A), disease activity index (B), and colon length (C, centimeter) of WT mice in response to DSS challenge.
-
D
Effect of PGD2 on Evan's blue extravasation in the colonic mucosa from WT mice.
-
E
Effect of PGD2 on DSS‐induced epithelial cell apoptosis in WT mice. Scale bars: 100 μm. The arrows indicate TUNEL+ cells.
-
F
Effect of PGD2 on colonic macrophage infiltration in DSS‐challenged WT mice. Scale bars: 100 μm. The arrows indicate CD301+CD68+ cells.
Data information: All mice were sacrificed at day 9. Data are shown as mean ± SEM. Statistical significance was determined using unpaired Student's
t‐tests. (A–C)
#
P < 0.05,
##
P < 0.01 vs. vehicle;
n = 7. (D)
##
P < 0.01 compared with vehicle;
n = 7. (E)
#
P < 0.05 compared with vehicle; vehicle,
n = 5; PGD
2,
n = 7. (F)
##
P < 0.01 compared with vehicle;
n = 5.