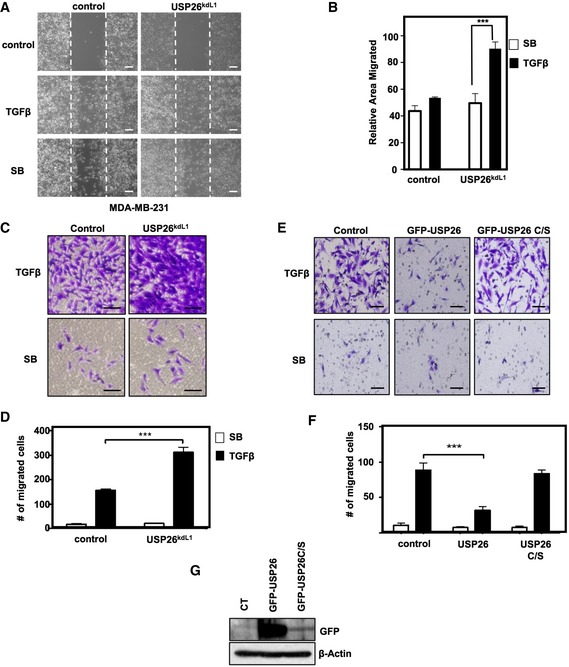
Figure 4. USP26 modulates TGF‐β‐mediated biological responses.

- MDA‐MB‐231 cells stably expressing a lentiviral hairpin targeting USP26 (L1) or relevant control vector were plated for scratch assay and treated with either SB431542 (5 μM) or TGF‐β (5 ng/ml); panels show migration at 0 and 24 h. Representative images are shown (scale bars, 50 μm).
- Percentage of migrated area within the white dotted lines was estimated with respect to control (0 h) and a graph was plotted. ***P < 0.001 using Student's t‐test. Data are mean ± SD of three random fields. Data are representative of two independent experiments with similar results.
- Transwell assay of MDA‐MB‐231 cells stably expressing a lentiviral hairpin targeting USP26 (L1) or relevant control vector treated with SB431542 (5 μM) or TGF‐β (5 ng/ml) for 16 h prior to fixation and crystal violet staining. Representative images are shown (scale bars, 100 μm).
- Graph represents average number of migrated cells taken from four different random fields from panel (C). Data are mean ± SD of triplicate samples from a representative experiment performed three times. ***P < 0.001 using Student's t‐test.
- Transwell assay of MDA‐MB‐231 cells stably expressing GFP‐USP26, GFP‐USP26 C/S, or relevant control vector treated with SB431542 (5 μM) or TGF‐β (5 ng/ml) for 16 h prior to fixation and crystal violet staining. Representative images are shown (scale bars, 100 μm).
- Graph represents average number of migrated cells taken from four different random fields from panel (E). Data are mean ± SD of triplicate samples from a representative experiment performed three times. ***P < 0.001 using Student's t‐test.
- Immunoblotting showing ectopically expressed GFP‐USP26, GFP‐USP26 C/S, or control vector in MDA‐MB‐231.
Source data are available online for this figure.
