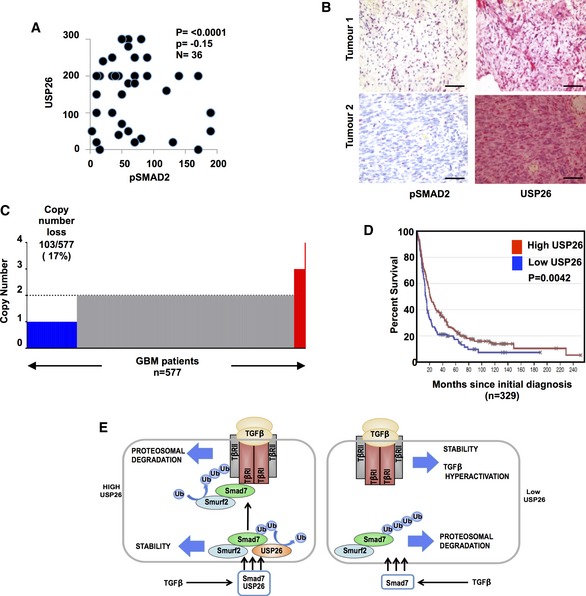
Figure 5. USP26 expression correlates with pSMAD2 levels in glioblastoma and poor overall survival.

- Scatter plot showing correlation with USP26 levels and pSMAD2 in tissue microarrays from human glioblastoma patients (n = 36). A Spearman's test was used to determine correlation between nuclear USP26 and nuclear pSMAD2 staining (P = −0.15). Statistical significance was determined by two‐tailed test (P < 0.0001).
- Immunohistochemical staining of USP26 and pSMAD2 in representative glioblastoma specimens from the GL806D (Biomax) tissue microarray. Red staining indicates positive immunoreactivity. Scale bars: 50 μm.
- Bar plots of USP26 gene level copy number (y‐axis) from TCGA glioblastoma (n = 577). Color code: copy number loss, blue; copy number gain, red; and copy number normal, gray.
- Kaplan–Meier curves showing that glioblastoma patients with low levels of USP26 have a significantly lower overall survival than patients with high levels of USP26 (P = 0.0042) (REMBRANDT). P‐value was obtained by log‐rank test.
- Schematic overview of USP26 converging with the SMAD7 complex to regulate SMAD7 stability and downregulate TGF‐β activity.
