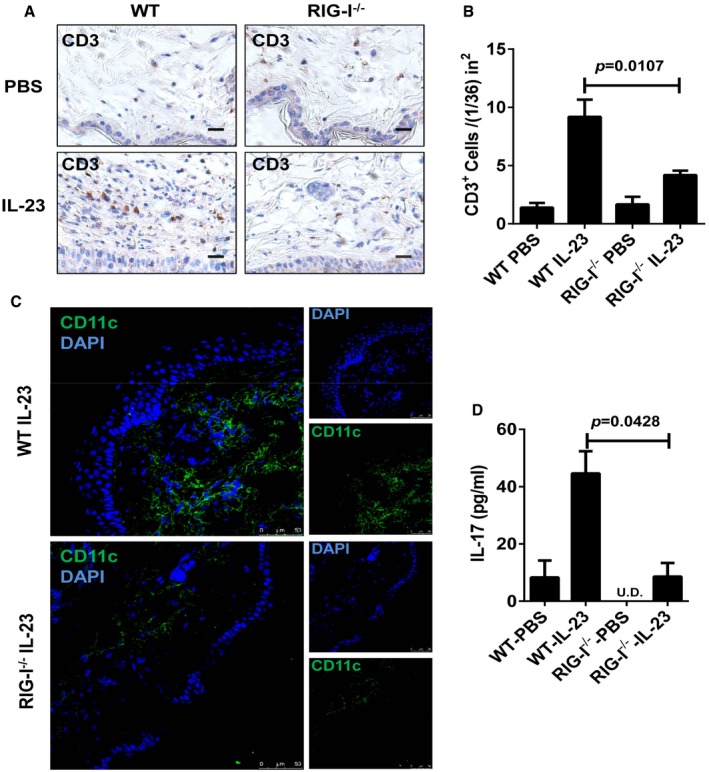
Figure EV2. Inflammatory cell infiltrates and IL‐17 expression levels in IL‐23‐induced mouse model.

- Representative immunostaining of CD3 in ear skin derived from WT and RIG‐I−/− mice treated with PBS or IL‐23, n = 3–5 per group. Scale bar: 20 μm.
- Quantitation of CD3+ cells in ear skin derived from WT and RIG‐I−/− mice treated with PBS or IL‐23. Significant differences are indicated: two‐tailed Student's t‐test, n = 3–5 per group (mean ± SEM).
- Representative immunofluorescence staining of CD11c in ear skin derived from WT and RIG‐I−/− mice treated with IL‐23, n = 3–5 per group. Scale bar: 50 μm.
- ELISA detection of IL‐17 protein levels in supernatants of ear skin homogenates derived from indicated groups. Significant differences are indicated: two‐tailed Student's t‐test, n = 3 per group (mean ± SEM).
