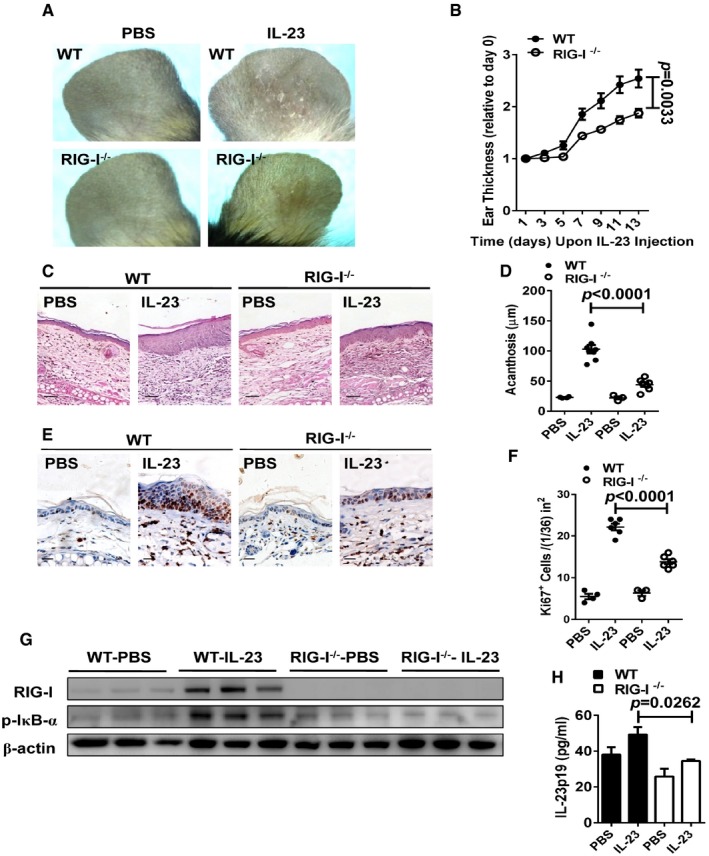
Figure 4. IL‐23‐induced psoriasis‐like skin disease is attenuated in RIG‐I−/− mice.

- Representative photographs of the ears of WT mice (upper panel) and RIG‐I−/− mice (lower panel) after intradermal injection with PBS or IL‐23 (500 ng) on every other day for eight times, n = 4–5 per group.
- The ear thickness of WT and RIG‐I−/− mice on the indicated day presented relative to day 0. Significant differences are indicated: P = 0.0033, one‐way ANOVA, n = 4–5 per group (mean ± SEM).
- Representative H&E staining of the ears treated as in (A), n = 4–5 per group. Scale bar: 50 μm.
- Acanthosis of WT and RIG‐I−/− mice treated with PBS or IL‐23. Significant differences are indicated: two‐tailed Student's t‐test, n = 3–8 per group (mean ± SEM).
- Representative immunostaining of Ki67 in ear skin derived from WT and RIG‐I−/− mice treated with PBS or IL‐23, n = 3–6 per group. Scale bar: 20 μm.
- Quantitation of Ki67+ cells in ear skin derived from WT and RIG‐I−/− mice treated with PBS or IL‐23. Significant differences are indicated: two‐tailed Student's t‐test, n = 3–6 per group (mean ± SEM).
- Western blot analysis of RIG‐I and p‐IκBα expression after treatment as in (A).
- ELISA detection of IL‐23p19 protein levels in supernatants of ear skin homogenates derived from indicated groups. Significant differences are indicated: two‐tailed Student's t‐test, n = 3 per group (mean ± SEM).
Source data are available online for this figure.
