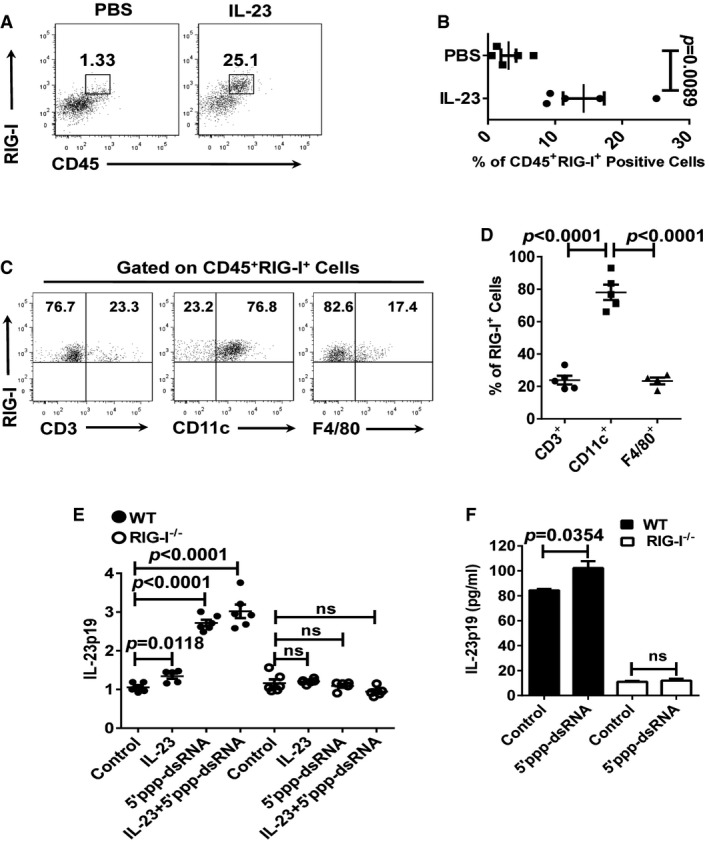
Representative flow cytometry analysis of the frequency of CD45+RIG‐I+ cells in WT ears treated with PBS or IL‐23 (n = 5).
Statistical analysis of the results in (A). Significant differences are indicated: two‐tailed Student's t‐test, n = 5 per group (mean ± SEM).
Representative flow cytometry analysis of the frequency of RIG‐I+CD3+, RIG‐I+CD11c+, and RIG‐I+F4/80+ cells in ears treated with IL‐23 (n = 4–5).
Statistical analysis of the results in (C). Significant differences are indicated: two‐tailed Student's t‐test, n = 4–5 per group (mean ± SEM).
qPCR analysis of IL‐23p19 mRNA expression of cultured WT BMDCs and RIG‐I−/− BMDCs treated with indicated stimulation for 24 h. qPCR values expressed as the ratio of mRNA to β‐actin, relative to negative control, and indicated as fold change. Significant differences are indicated: two‐tailed Student's t‐test, n = 5–6 per group (mean ± SEM).
ELISA detection of IL‐23p19 protein levels in supernatants of cultured WT BMDCs and RIG‐I−/− BMDCs treated with indicated stimulation for 48 h. Significant differences are indicated: two‐tailed Student's t‐test, n = 3 per group (mean ± SEM).