-
A
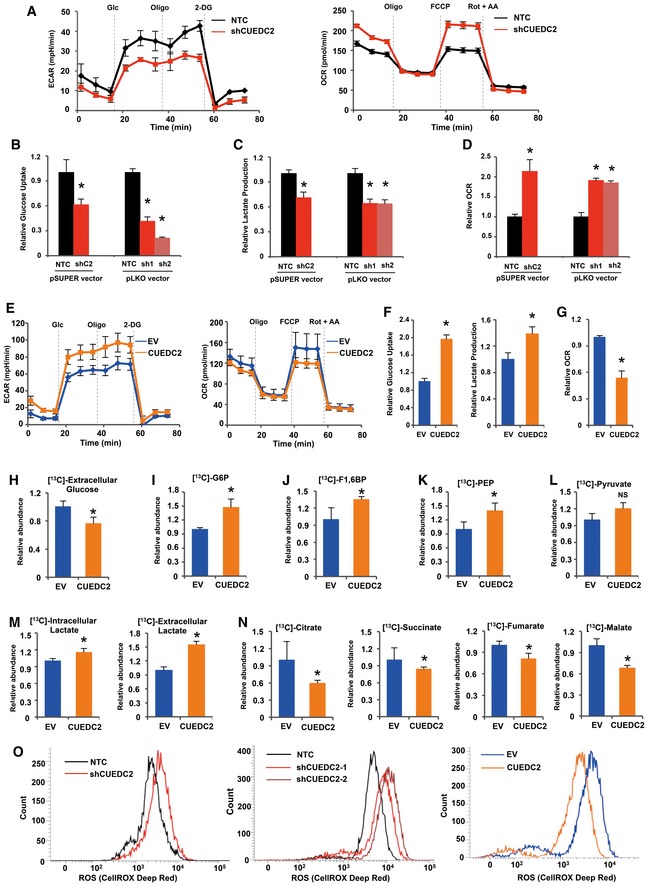
Extracellular acidification rate (ECAR) and O2 consumption rate (OCR) of PLC cells stably expressing shCUEDC2 or NTC were detected using a Seahorse Bioscience XFp analyzer.
-
B
Cellular glucose uptake was measured in PLC cells stably expressing shCUEDC2 or NTC in pSUPER or pLKO vectors using the glucose assay kit. The data were normalized to protein concentrations.
-
C
Extracellular lactate production was measured in PLC cells stably expressing shCUEDC2s or NTC in pSUPER or pLKO vectors using lactate assay kit. The data were normalized to protein concentrations.
-
D
Equal numbers of PLC cells stably expressing shCUEDC2s or NTC in pSUPER or pLKO vectors were subjected to an Oxytherm unit to measure the O2 consumption rate.
-
E
ECAR and OCR of PLC cells with stable overexpression of CUEDC2 were detected using a Seahorse Bioscience XFp analyzer.
-
F
Cellular glucose uptake and extracellular lactate production were measured in PLC cells with stable overexpression of CUEDC2 or empty vector (EV) using the glucose or lactate assay kit. The data were normalized to protein concentration.
-
G
Equal numbers of PLC cells with stable overexpression of CUEDC2 or EV were subjected to an Oxytherm unit to measure their O2 consumption rate.
-
H–N
PLC cells with stable overexpression of CUEDC2 or EV were cultured in medium containing 13C‐labeled glucose for 36 hours. Extracellular 13C‐labeled glucose (H), 13C‐G6P (I), 13C‐F1,6BP (J), 13C‐PEP (K), 13C‐pyruvate (L), intracellular and extracellular 13C‐lactate (M), and cellular 13C‐labeling TCA cycle metabolites (N) were measured by GC‐MS.
-
O
Cellular reactive oxygen species (ROS) were detected by flow cytometry using CellROX DeepRed staining in PLC cells expressing shCUEDC2s (in pSUPER vector, left panel; in pLKO vector, middle panel) or overexpressing CUEDC2 (right panel).
Data information: Data are presented as mean (± SD). In (A–G)
n = 3 in each group, and in (H–N)
n = 5 in each group. *
P < 0.05 as compared to NTC group in (A–D) and to EV group in (E–N), respectively.
P was calculated by Student's
t‐test. The representative results of three independent experiments are shown in (O).

