-
A, B
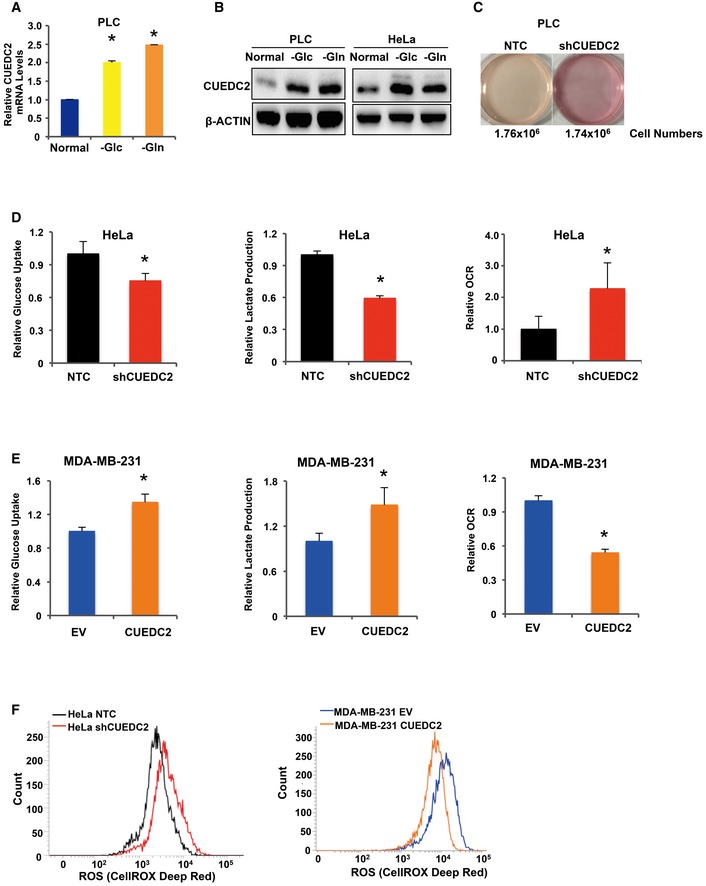
mRNA (A) and protein (B) levels of CUEDC2 were determined by qRT–PCR and Western blot, respectively, in glucose‐ or glutamine‐starved PLC cells (A, B) or HeLa cells (B).
-
C
The medium color of cultured PLC cells expressing shCUEDC2 was much pinker than that of control cells expressing NTC. The cell numbers were 1.76 × 10⁶ for NTC cells and 1.74 × 10⁶ for shCUEDC2 cells, respectively.
-
D, E
Cellular glucose uptake, lactate production, and O2 consumption rate were measured in HeLa cells expressing shCUEDC2 (D) or MDA‐MB‐231 cells stably overexpressing HA‐CUEDC2 (E).
-
F
Cellular ROS levels were detected by flow cytometry using CellROX DeepRed staining in HeLa cells expressing shCUEDC2 and MDA‐MB‐231 cells overexpressing CUEDC2.
Data information: (A, D, E) Data are presented as mean (± SD);
n = 3 in each group. *
P < 0.05 as compared to normal group in (A), to NTC group in (D) and to EV group in (E), respectively.
P was calculated by Student's
t‐test. The representative results of three independent experiments are shown in (F). β‐Actin served as loading control.
Source data are available online for this figure.

