
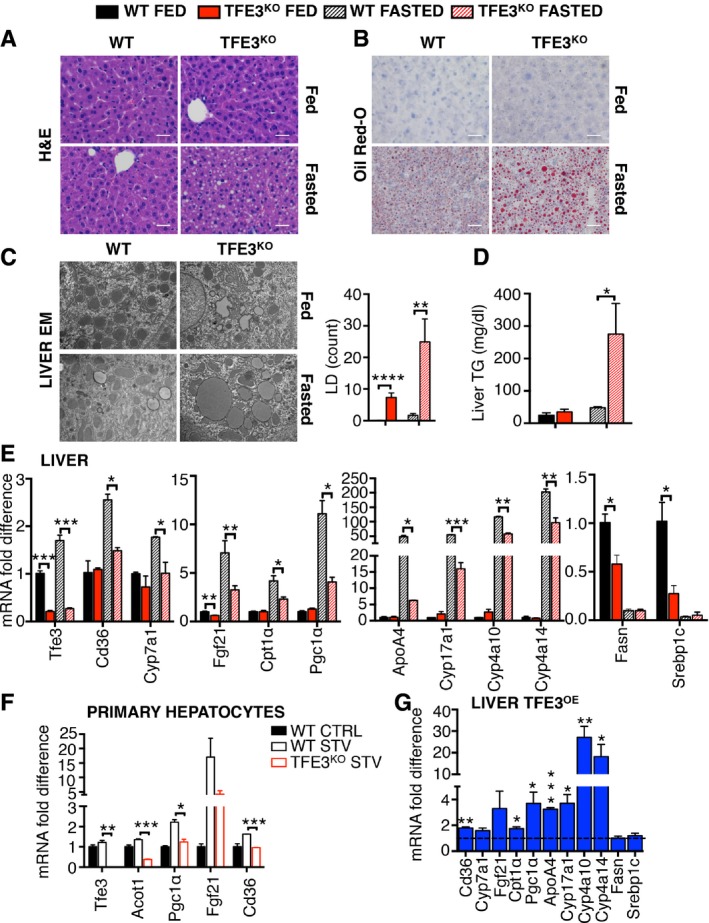
Figure EV2. TFE3 regulates β‐oxidation during starvation.
-
A–DHaematoxylin and eosin (H&E) staining (A), Oil Red O (B) and electron microscopy images (C) with the relative quantification of the lipid droplets and liver triglyceride (TG) levels (D) of livers isolated from fed and 24‐h‐fasted Tfe3 KO and control mice (n = 5 per group) (scale bars H&E: 20 μm; scale bars Oil Red O: 50 μm). Data are presented as mean ± SEM. Student's two‐tailed t‐test: ****P < 0.0001; **P = 0.0041; *P = 0.0288.
-
EQuantification of mRNA levels of genes involved in lipid metabolism in livers from WT and Tfe3 KO mice treated as indicated (n = 3 per group). Data are presented as mean ± SEM. Student's two‐tailed t‐test: Tfe3 ***P < 0.001; Cd36 *P = 0.0162; Cyp7a1 *P = 0.05; Fgf21 **P = 0.0011; Cpt1α *P = 0.0307; Pgc1α *P = 0.0147; ApoA4 *P = 0.0147; Cyp17a1 ***P = 0.0005; Cyp4a10 **P = 0.0056; Cyp4a14 **P = 0.0048; Fasn **P = 0.0275; Srebp1c *P = 0.0255.
-
FQuantification of mRNA levels of genes involved in lipid metabolism in primary hepatocytes from WT and Tfe3 KO mice treated as indicated. Data are presented as mean ± SEM. Student's two‐tailed t‐test: Tfe3 **P < 0.003; Acot1 ***P = 0.0007; Pgc1α *P = 0.0159; Cd36 ***P = 0.0002.
-
GExpression of genes involved in lipid metabolism in livers from HDAd‐PEPCK‐TFE3 injected mice (n = 3 per group). Values were normalized to control livers (dashed line). Data are presented as mean ± SEM. Student's two‐tailed t‐test: Cd36 **P = 0.0018; Cpt1α *P = 0.0449; Pgc1α *P = 0.0207; ApoA4 ***P = 0.0004; Cyp17a1 *P = 0.0162; Cyp4a10 **P = 0.0067; Cyp4a14 *P = 0.0480.