
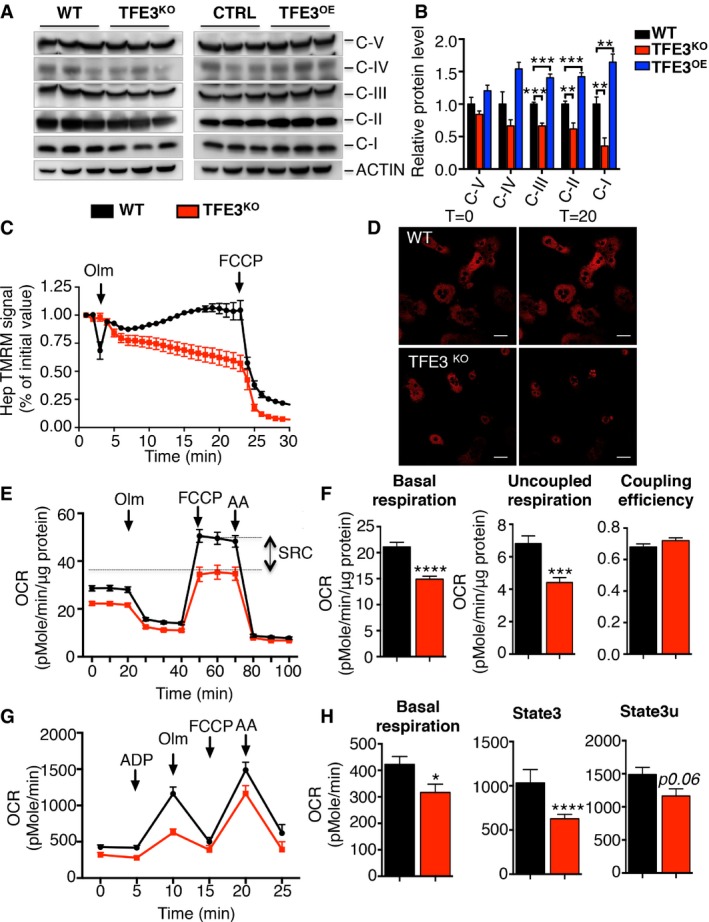
Figure 6. TFE3 regulates mitochondrial function.
-
A, BOXPHOS protein levels in liver from WT, Tfe3 KO and TFE3‐overexpressing mice fed a chow diet (A) and relative protein quantification (B) (n = 3 per group). Data are presented as mean ± SEM. Student's two‐tailed t‐test: CIII Tfe3 KO ***P = 0.0003, Tfe3OE ***P = 0.0002; CII Tfe3 KO **P = 0.0036, Tfe3OE ***P = 0.0004; CI Tfe3 KO **P = 0.0088, Tfe3OE **P = 0.0049.
-
CMitochondrial membrane potential in primary hepatocytes isolated from WT and Tfe3 KO mice (n = 5 WT and n = 8 Tfe3 KO). TMRM signal was quantified as percentage of initial value. Where indicated, oligomycin (olm) or protonophore carbonylcyanide‐p‐trifluoromethoxyphenyl hydrazone (FCCP) was added. Data are presented as mean ± SEM.
-
DRepresentative images of TMRM signal at the indicated time points after olm addition (scale bars: 100 μm).
-
EBioenergetic assay in hepatocytes from control and Tfe3 KO mice (n = 4). Where indicated, olm, FCCP or antimycin A (AA) was added. Data were normalized for protein content. Data are presented as mean ± SEM.
-
FThe basal OCR, uncoupled respiration (proton leak) and uncoupling efficiency (ATP turnover/basal OCR) calculated based on data in (E). Data are presented as mean ± SEM. Student's two‐tailed t‐test: ****P < 0.0001; ***P = 0.0003.
-
GCoupling assay in mitochondria isolated from WT and Tfe3 KO livers (n = 4). Where indicated, ADP, olm, FCCP or antimycin A (AA) was added. Data are presented as mean ± SEM.
-
HOCR basal, at state 3 and state 3u determined based on data in (G). Data are presented as mean ± SEM. Student's two‐tailed t‐test: *P = 0.0309; ****P < 0.0001.
Source data are available online for this figure.